

Year: 2001 Vol. 67 Ed. 3 - (2º)
Artigos Originais
Pages: 297 to 304
Youth's Habits and Hearing Threshold in Relation to Exposure to Electronically Amplified Music in Discotechs.
Author(s):
José J. Jorge Jr.*,
Afonso C. M. Alegre**,
Maria C. Greco***,
Maria C. A. Angelini****,
Patrícia M. Barros*****.
Keywords: auditory thresholds, noise exposition, music, youth
Abstract:
Study design: Clinical prospective. Material and method: The authors evaluated the hearing threshold levels of youngmen who expose themselves to music that is presented in closed environments that the authors called exposition to Environmental Amplified Music. 908 subjects between 14 and 26 years old were analised through questionary and audiometry. They were divided in groups that expose themselves less than once a week, once or more than once a week. Conclusion: The: authors observed that there is a tendency of increasing the number of subjects with impaired hearing thresholds in relation of the exposition ratio, mainly on the group that is exposed more than once a week and markedly on the older subjects.
![]()
INTRODUCTION
As a vesult of the progression of electronics, the power of stereo devices and musical instruments increased considerably. The loudness of music played in different halls is extremely loud and does not support conversation. Intensity reaches 122dB HL in such places, exceeding hearing risk levels, according to the parameters adopted by the state of California, USA12,14. Big rock groups carry around amplification equipment with thousands of watts of power, exceeding the level of 120dBHL close to the loudspeakers.
Lebo12 measured sound intensity in live music show halls. He noticed that in such places sound intensity exceeded the limits set forth by the legislation of the state. He described the environment as follows: "The main instruments were amplified guitars and percussion sets. The sound was captured by two heavily amplified microphones. The music was characterized by marked beats, varied harmonic variation and simple themes with variation, presenting a dynamic range of sounds between forte and fortissimo."
Rintelmann and Borus17, impressed by the problem and motivated by the lay literature about the topic, thought that if someone had an acoustic trauma from exposure to this kind of music, it would be the musician. Therefore, they conducted a study in which they analyzed sound pressure levels of six rock bands, defining the hearing thresholds of 42 musicians of these bands and the authors found that only two of them (5 %) had some kind of hearing threshold alteration. According to the authors, two findings should be taken into account upon the analysis of the results: first, that in live shows there is always a break between the songs, that is, one minute break after 5 or 6 minutes of playing, and it would be enough for the auditory system to recover; second, we should always consider individual susceptibility as an important factor.
Lipscomb15 studied 3,000 subjects and found some with hearing losses above 2,000Hz (12.6% of high school students). The author believed that the loss had been caused by exposure to loud intensity sounds, especially rock music: "discos and teenager parties present dangerously loud sound intensity". In a study with guinea pigs, the author demonstrated cochlear lesion after experimental noise exposure similar to the levels measured in discos and dance halls (122 dB).
Rupp18 wrote an interesting introduction for the article published in 1969, whose title is curious enough "Effects of Too Loud Music on Human Ears. But, Mother, Rock'n'Roll Has to Be Loud!". He performed audiometry in five members of a rock group before and right after a two-and-half hour presentation. He found TTS (temporary threshold shift) in high frequencies (4,000 and 6,000Hz) after the presentation. He also measured sound pressure levels generated by these concert halls and he found 120 to 130 dB.
Speaks19 measured the sound intensity of rock bands and also detected TTS in 25 of 44 musicians enrolled in the study. He conducted audiogram before and right after the performance. He also obtained the measure of 105 to 120 dB SPL on the stage where the groups were playing.
Jerger and Jerger' studied the members of two rock bands. Eight out of 15 musicians showed TTS between 2,000 and 8,000Hz. Three of them had a probable noise-induced hearing loss in the pre-exposure audiogram. The authors concluded, however, that they could not guarantee that the losses had been caused by music exposure, since there were other potentially harmful high frequency noises in the world.
Fearn (apud Whittle23) studied the differences in hearing thresholds of youngsters who used to go to discos and other who did not and he found small differences in thresholds, which were constant and statistically significant. The author also noticed that the more the youngsters went to the disco, the larger the differences were. In average, there was a 2.0 dB difference for those who went once a month, 4 dB for once every two weeks, and 6.8dB for once a week. He also found statistically significant differences between youngsters who went to the disco one a week and those who went once a month.
Objective: to evaluate the correlation between indoor exposure to music and hearing thresholds of youngsters aged 18 years.
MATERIAL AND METHOD
Nine hundred fifty-seven both gender subjects, aged 14 to 26 years, students of a middle to upper class private school in São Paulo, Brazil. The subjects were submitted to physical inspection with otoscopy, questionnaire about personal and family history and habits about environmental noise, and audiogram in the frequencies 500 Hz, 1000 Hz, 2000 Hz, 3000 Hz, 4000 Hz, 6000 Hz and 8000 Hz.
A sound proof booth was assembled in a classroom. Audiometries were conducted with audiometer Dicton model CAT 745.
Based on the screening procedures suggested by Glorig6 (1958), which indicated the level of 15 dB HL as reference for the procedure, we started from this intensity in each studied frequency.
According to ISO-1964, we adopted 25 dB as the normal limit. Normal range values vary from -10 dB to 26dB HL, and responses between 27 and 40dB are classified as mild loss10.
The cases considered impaired had: a) frequencies with pure tone thresholds equal or higher than 30dB HL; b) ears with one or more impaired frequencies; c) one or both ears impaired.
For the present study, we excluded the frequencies 500, 1,000 and 2,000Hz because based on our experience and the literature, we know that the incidence of noise-induced sensorineural hearing loss initially affects high frequencies, especially frequencies above 3,000Hz7,15. Therefore, we considered the frequencies 3,000, 4,000, 6,000 and 8,000Hz.
The questionnaire addressed personal and family otologic history, potentially harmful hearing habits, especially habits concerning amplified electronic music8,9.
Environmental amplified music
We defined as exposure to environmental amplified music (EAM) as the music transmitted by powerful amplifying loudspeakers in closed places. They are the party rooms and the so-called discos. We have also included outdoors live rock concerts in which the power of equipment is extremely high8.
Selection and classification of sample
Out of 957 subjects, 49 (5.12%) were initially excluded because they had congenital hearing loss or wax, worked in noisy environments, or presented undiagnosed severe hearing loss. Next, we excluded subjects who had long lasting ear infections and presented some degree of hearing loss. Subjects with congenital ear problems and those who used to practice shooting were also excluded. None of the subjects had been in the army service.
There were 908 subjects (557 - 61.34% male and 351- 38.66% female subjects) who actually participated in the study.
We also divided the sample into two age ranges in order to analyze behavior as a result of age: 14 to 17 years (523 subjects or 57.60%), called under age group, and 18 to 26 years (385 subjects or 42.40%), called over age group.
Next, we divided the sample based on exposure to electronically amplified music, considering subjects that:
were not exposed to environmental amplified music (EAM) or individual amplified music (UM), called group A;
were exposed exclusively to UM, called group B;
were exposed to EAM less than once a week, called group C;
were exposed to EAM once a week, called group D;
were exposed to EAM more than once a week, called group E.
In the present study, we will address groups A, C, D and E, involved with environmental amplified music. Group B has already been the focus of another published study9.
RESULTS
Distribution of sample
The distribution of the 908 subjects concerning habits of exposure to electronically amplified music, collected by the answers to the questionnaire, was proceeded as follows:
control group - A (13.55%);
group of subjects exposed only to LAM - B (18.72%);
group of subjects exposed to EAM less than one a week - C (39.43%);
group of subjects exposed to EAM once a week - D (21.37%);
and group of subjects exposed to EAM more than once a week - E (6.94%).
Therefore, as to subjects exposed to EAM, we noticed that the vast majority seldom or sometimes go to the places (Groups A, B and C added up = 71.70%).
In the present study, we did not consider group B because it has already been addressed by another publication9.
Behavior of the population concerning habits of exposure of electronically amplified music and age ranges.
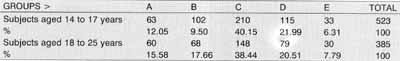
Table 1 shows the distribution of groups according to studied age ranges. We could observe that they behaved similarly in terms of percentage, that is, the habits of the studied population did not differ significantly between the younger (14 to 17 years) and the older (18 to 26 years) age ranges, what made us consider that older subjects have been exposed longer to EAM, because they still maintained the same habits.
Differently from what we thought, the exposure to EAM more than once a week (group E) had approximately the same proportion for both age ranges: from 14 to 17 years, there were 33 subjects, corresponding to 6.31%, and from 18 to 26 years, there were 30 subjects, corresponding to 7.79% of the total sample, within each range. This was not a statistically significant difference (x2 = 0,76; 1g.l.; a=0.05).
a=0,05 .3,84
In order to appraise the fact, we considered for how long the subject has been going to this kind of place. There were 371 answers to this question and considering the mean age and the informed exposure time, we could observe in Graph 1 that there was an increase in exposure as a result of aging. The mean exposure obtained for the age range 14 to 17 years was 2.35 years and in the age rage 18 to 26 years it was 5.46 years.TABLE 1 - Distribution of subjects in the age range 14 to 17 and 18 to 26 years as to the habit of exposure to amplified music. A = control group; B = exposed to individual amplified music; C = exposed to environmental amplified music at least once a week; D = exposed to environmental amplified music once a week; E = exposed to environmental amplified music more than once a week.
Analysis of the distribution of unpaired subjects within, each group.
We analyzed in each of the 5 groups the distribution of impaired subjects in the studied age ranges (14-17 years and 18-26 years) and according to gender.
Control group (group A) (123 subjects)
The subjects in this group were distributed according to Table 2, considering the number of impaired and non-impaired subjects.
Out of 123 subjects, nine were impaired (7,31%).
Statistical analysis showed that when we compared both ranges, there was no statistically significant difference concerning the number of subjects with hearing thresholds impairment (x² corrected = 2.14; 1g.l; ? = 0.05).
The same non-significant result was obtained from the comparison of impaired thresholds between genders in both age ranges (x² corrected = 1.61; 1g,l.; ? = 0.05).
Group of subjects exposed to EAM less than once a week (group C)
Results obtained from the 358 subjects who reported that they were exposed less than once a week are presented in Table 3.
Out of the total of 358 subjects, 30 were impaired subjects (8.38%).
In this group, statistical analysis demonstrated that there was no statistically significant difference of number of impaired subjects between age ranges (x²= 3.17; 1g.l.; a = 0.05). The same was true for genders (x²= 1.33; 1g.l.; a = 0.05).
Group of subjects exposed to EAM once a week (group D)
Table 4 considers 194 subjects exposed to EAM once a week. Out of the total of 194 subjects, 20 were impaired (10.31%).
Graph 1. Mean duration of exposure to EAM reported by subjects according to age range. Note: In the age range 24, 25 and 26 years only one subject answered the question in each of them.
TABLE 2 - Distribution of control group or group A, concerning impairment of hearing thresholds and age range and gender.
TABLE 3 - Distribution of subjects exposed to environmental amplified music less than once a week (group C) concerning hearing thresholds, age range and gender.
TABLE 4 - Distribution of subjects exposed to environmental amplified music once a week (group D) concerning hearing thresholds, age range and gender.
In this group, the analysis of age ranges showed no statistically significant difference in number of subjects with impaired hearing thresholds (x² =1.89; 1g.l.; a = 0.05). The same was true for the analysis of gender - not significant (x² = 0.1; 1g.l.; a = 0.05).
Groups exposed to EAM more than once a week (group E)
Table 5 shows results concerning the 63 subjects who were exposed to EAM more than once a week, considering impaired and non-impaired subjects.
Out of 63 subjects, 11 were impaired (17.46%).
There was statistically significant difference between the number of subjects with impaired hearing thresholds when the two age ranges were compared (x2 corrected = 6.26; 1g.l.; a = 0.05): the age range 18 to 26 years was more impaired.
Upon the comparison of impaired subjects and gender in this group, we did not find statistically significant difference (x² corrected = 2.95; 1g.l.; a = 0.05).
To sum up, in subjects exposed to EAM (groups C, D and E), only those exposed more than once a week (group E), presented statistically significant differences concerning number of impaired subjects and studied age ranges, but there were no differences concerning gender.
Comparison of data from the groups exposed to EAM and control group
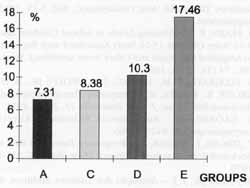
Graph 2 shows the percentage of groups C, D and E and the control group (A), considering impaired subjects.
There were no statistically significant differences when comparing groups C and D and the control group concerning number of impaired subjects (x² =0.08 e x = 0.81, respectively).
However, in the group exposed to EAM more than once a week (group E), out of 63 subjects, 11 (17.46%) presented impaired hearing 'thresholds. It had been previously observed in the group that among the age ranges there was no statistically significant difference concerning frequency of exposure to EAM. We noticed that in older subjects there is more time of exposure and higher number of impaired subjects, as demonstrated. Therefore, we then analyzed if the group had more impaired subjects than the control group. We compared both age range groups and found in the age range 18 to 26 years that the number of impaired subjects was statistically higher in group E than in the control group (x2 = 4.69 for 1g.l., a =0.05). Nevertheless, in the age range from 14 to 17 years there was no statistically significant difference with the control group (x2corrected = 0.77; 1 g.l.; a = 0.05).TABLE 5 - Distribution of subjects exposed to environmental amplified music more than once a week (group E) concerning hearing thresholds, age range and gender.
Therefore, by analyzing the groups of subjects exposed to previous EAM, only subjects exposed more than once a week to EAM showed significant differences in hearing thresholds when compared to the control group.
Graph 2. Comparison in percentage of impaired cases considering the control group (A - 7.31%) and the subjects exposed to environmental amplified music, represented by groups C (8.38%), D (10.30%) and E (17.46%).
DISCUSSION
Different authors discussed if sound intensity levels were really harmful to the hearing system. The authors who studied sound pressure levels in the environment and in machinery showed extremely high levels, exceeding the known risk limits11 and the levels dictated by the regulating agencies.
We noticed that researchers detected sound pressure levels that ranged from 99dB2 to 130 Db18. By investigation in loco or in the laboratory, they found TTS in most of the studied subjects - some presented severe TTS (up to 50dB) and long lasting TTS (Smitley, 1971), leading to the potential risk of hearing damage.
Rintelmann and Borus17 did not believe in the hypothesis of permanent cochlear lesion; they studied members of a rock group and they did not find this kind of lesions. A number of authors, among which Lipscomb15, disagreed by presenting data from a study with the same kind of musicians and they found damage in hearing thresholds. The latter supported his findings in researches of inner ears of guinea pigs exposed to similar noises and criticized Rintelmann for not having investigated the frequency of 6,000Hz.
Four factors are listed by Tamura20 as responsible for sensorineural losses: intense sound pressure level of sources, characteristics of duration and of frequency and individual susceptibility. However, two of them are considered as the most important ones: the first is that music "noise" is not constant for many hours, because there is always an interval during musical selection, either playing live or recorded, allowing some time for the fatigued system to recover. Some authors suggested that one minute of interval would be enough to recover the system. The other factor - and probably the most important one - is individual .susceptibility, involving a genetic load that would protect - or not - the organ from exposures. This fact is observed when musicians from an orchestra or band are analyzed and some have hearing impairment whereas other do not, but all of them are exposed to the same sound intensity during the same period of time. Most of the authors have also concluded that sound pressure levels to which youngsters are exposed are potentially but not necessarily harmful to the ear.
As to exposure to EAM, we observed that most of the subjects seldom or sometime go to discos or similar show halls. It is interesting to point out that, differently from what we thought, as to frequency of exposure to EAM, there was no statistically significant difference between the groups under age and over age, despite the fact that the older subjects are legally authorized to go to these places. We also concluded, through the questionnaire, that older subjects had been exposed for more time: based on their data, we collected a mean exposure time of 2.35 years for the age range 14 to 17 years and 5.46 years for the age range 18 to 26 years.
As to gender, we observed that men were the ones that most frequently went to discos, among subjects from groups D and E.
Although authors in general believe that electronically amplified music is potentially harmful, they agree that few subjects are affected by this kind of lesion. However, Dey2 stated that the society would have to bear the costs of this attitude, because youngsters tend not to care about these aspects. In different studied articles, we noticed that significant TTS were noted by the authors, who they did not find permanent threshold shift (PTS) definitely caused by exposure to electronic music. Nevertheless, Fearn studied the differences in auditory thresholds among subjects who were exposed and not exposed to EAM and he found statistically significant differences of thresholds in those that went to discos once a week compared to once a month.
In our study, as we have already defined, we adopted the normal range of 25dB HL; therefore, impaired subjects were those who had thresholds above 30dBHL in any of the studied frequencies.
The control group was chosen based on a questionnaire in which the subjects informed if they were exposed to IAM or EAM. In this group, the number of subjects with thresholds above 30dBHL, in both age ranges, was statistically the same, and therefore, we can say it was a homogenous group. The same was true for gender.
By analyzing the group of subjects exposed to EAM, we noticed that for those who went to discos with EAM more than once a week, there was a higher statistically significant difference in the number of older subjects than younger subjects.
This conclusion was extremely important for our study because more mature subjects have been exposed to EAM since they were younger, thus, duration of exposure is much longer.
Upon comparing the subjects exposed to EAM and the control group, we found that the number of impaired subjects who went to the disco less than once a week or up to once a week did not present statistically significant difference. However, the group of subjects exposed to EAM more than once a week presented a significantly larger number of subjects with impairment of hearing thresholds. By analyzing these data and age ranges, we noticed that the difference was more marked in the older range, exposed for a longer time.
This fact led us to the conclusion that there is a group that is more susceptible to hearing damages, which we may call risk group. Subjects who are exposed occasionally, or even exposed once a week to EAM, did not differ in the studied population from those who rarely go to these places; the same was not confirmed for the group that is frequently exposed to EAM, which, added to other factors, result in higher predisposition for hearing loss.
In the groups exposed to EAM once a week or less, we did not find statistically significant difference concerning the number of impaired subjects, considering both age and gender.
CONCLUSIONS
Youngsters in general are occasionally exposed to environmental amplified, music and the group that goes to discos more than once a week is very small. Male subjects are more exposed than female subjects.
There is an increasing trend in the number of youngsters with impaired hearing thresholds as a result of exposure to EAM. This number is significant in the group that is exposed more than once a week when compared to the control group, especially in the older age range (18 to 26 years).
REFERENCES
1. CHAWDWICK, D. L. - Music and Hearing. Proc. R. Soc. Med., 66, 1078-82, 1973.
2. DEY, F. L. - Auditory Fatigue and Predicted Permanent Hearing Defects from Rock-and-Roll Music. New England I. Med., 282, 467-70, 1970.
3. ENGSTRÖM, B.; BORG, E. - Cochlear Morphology Auditory Threshold. Acta Otolaryngol., 402, 5-23, 1983. Supplement.
4. FEARN, R. W - Hearing Levels in School Children aged 9-12 Years Old and 13-16 Years Associated with Exposure to Amplified Pop Music and Other Noisy Activities) Sound Vib., 74 (1), 151-3, 1981.
5. FLUGRATH, J. M.; IRWING, J. A.; WOLFE JR., B. N.; KRONE, B.; PARNEL, M. - Temporary Threshold Shift and Rock-and-Roll Music.) Aud. Research, 11, 291-3, 1971.
6. GLORIG, A. - Audiometric References Levels. Laryngoscope, 76, 842-9, 1966.
7. JERGER, J.; JERGER, S. - Temporary Threshold Shift in Rock-and-Roll Musicians. J. Speech Hear. Res., 13, 221-4, 1970.
8. JORGE JR., J. J. - Avaliação dos Limiares Auditivos de Jovens a Sua Relação com Hábitos de Exposição a Música Eletronicamente Amplificada. São Paulo, 1993. 113 Tese (Doutorado) - Faculdade de Medicina da Universidade de São Paulo.
9. JORGE JR, J. J. - Hábitos a Limiares Auditivos de Jovens em Relação a Musica Eletronicamente Amplificada Através de Equipamentos Com Fones de Ouvido. - 1996
10. KATZ, J. -Handbook of Clinical Audiology. Baltimore, The Williams and Wilkins Co., 1975.
11. KRYTER, K. - Hazardous Exposure to Intermittent and Steady State Noise. Report of Working Group 46, NAS-NCR Committee on Hearing, Bioacoustics and Biomechanics. J Acoustic_Soc. Amen, 39, 451-64, 1966.
12. LEBO, C. E; OLIPHANT, K. S.; GARRET, J. - Acoustic Trauma From Rock-and-Roll Music. California Medicine, 107, 378-80, 1967.
13. LEBO, C. E; OLIPHANT, K. S. - Music as a Source of Acoustic Trauma. Laryngoscope, 78, 1211-8, 1968.
14. LIPSCOMB, D. M. - High Intensity Sounds in the Recreational Environment. Clin. Pediatrics, 8, 63-8, 1969.
15. LIPSCOMB, D. M. - Ear Damage from Exposure to Rock-and-Roll Music. Arch. Otolaryngol, 90, 545-55, 1969.
16. PANTHER, C. H. - Hearing Level Measurements on Students Aged 18 to 25 Years Exposed to Disco and Pop Music. J Sound Vib., 113, 401-43, 1987.
17. RINTELMANN, W F.; BORUS, J. F. - Noise-Induced Hearing Loss and Rock-and-Roll Music. Arch. Otolaryngol, 88, 377-385, 1968.
18. RUPP, R. R.; KOCH, L. J. - Effects of Too Loud Music on Human Ears. But, Mother, Rock'n'Roll Has to Be Loud! Clinical Pediatrics, 8, 60-2, 1969.
19. SPEAKS, C.; NELSON, D.; WARD, W D. - Hearing Loss in Rock-and-Roll Musicians. J. Occup. Med., 12, 216-9, 1970.
20. TAMURA, N. - Hearing Loss Caused by Musical Sounds of Concert. Shigaku, 75, 1005-12, 1987.
21. ULRICH, R. F.; PINHEIRO, M. L. - Temporary Hearing Losses in Teenagers Attending Repeated Rock-and-Roll Music. Acta Otolaryngol, 77, 51-5, 1974.
22. WARD, W D.; DUVAL, A. J. III - Behavioral and Ultrastructural Correlates of Acoustic Trauma. Ann. Otol., 80, 881-96, 1971.
23. WHITTLE, L. S.; ROBINSON, D. W - Discotheques and Pop Music as a Source of Noise Induced Hearing Loss - A Review and Bibliography. National Physical Lab Acoustic Report, 66, 1974.
* Ph.D., Associate Professor, Department of Surgery, Coordinator of the Discipline of Otorhinolaryngology, Faculdade de Ciências Médicas de Sorocaba, PUCSP
** Ph.D., Assistant Professor, Discipline of Otorhinolaryngology USP
*** Audiologist and Speech Therapist, Santa Casa de São Paulo and Unidade de Fonoaudiologia a Otorrinolaringologia SC Ltda.
**** Audiologist and Speech Therapist, Unidade de Fonoaudiologia a Otorrinolaringologia SC Ltda.
***** Audiologist and Speech Therapist.
Address correspondence to: Dr. José Jarjura Jorge Jr. - Rua Dr. Bacelar, 621 - Vila Clementino - 04026-001 São Paulo/SP
Article submitted on December 4, 2000. Article accepted on January 24, 2001.
Print: ![]()