

Year: 2001 Vol. 67 Ed. 2 - (4º)
Artigos Originais
Pages: 160 to 169
Temporary Threshold Shift Due to Hearing Aid Use.
Author(s):
Ursulina M. L. De Vitto*,
Oswaldo L. M. Cruz**.
Keywords: auditory threshold, temporary threshold shift, sensorineural hearing loss, noise induced hearing loss, hearing-aid
Abstract:
Introduction: Noise induced hearing loss caused by hearing aid use, or specifically by the overamplification, was studied since their inventory. Similarly with other noises that caused hearing disorders, the hearing loss caused by hearing aid use, can be temporary or to became gradually permanent. Purpose: This study intended to analyse temporary threshold shift in patients with moderate to profound bilateral sensorineural hearing loss after some hours of continuous hearing aid use in one of the ear. Study design: Clinical prospective. Material and method: We evaluated a sample of 27 subjects, performing a total of 54 ears, with the age ranging from 8 to 49 years old, of both sexes, served by the Donation Program for Orthesis and Hearing Aids from the Secretaria da Saúde do Estado de São Paulo. Both ears of the subjects were included in the study: the ears with hearing aids, formed the Aided or Experimental Group, and the ears without hearing aids, formed the Unaided or Control Group. The audiometric threshold by air conduction, was measured in two diferent moments: Pré-use and Post -use of the hearing aid, in order to evaluated any possible changes, and the noise in the room was systematically controlled by a digital dosimeter. Results and Conclusions: We found statistically significant threshold shift (P<0,05): Control Group (500, 1,000, 2,000 and 6,000 Hz); Aided Group (1,000, 2,000, 3,000 e 4,000 Hz); Aided Group / Control Group (1,000, 2,000, 3,000 and 4,000 Hz). The temporary threshold shift in the Hearing aid Group could be partly attributed to the use of the hearing aid once these alterations were more significant in this group. We also confirmed statistically significant temporary shifts (F(0,05) for the Aided Group in the frequencies 1,000, 2,000 e 3,000 Hz. Both of the correlation studied: Degree of Hearing Loss / Threshold Shift and Degree of Hearing Loss/ Hearing Aid Amplification was statistically very low (c<0,40). However, it was possible to show the behavior: Degree of Hearing Loss / Threshold Shift: when one increased, the other decreased; Degree of Hearing Loss/ Hearing Aid Amplification: when one increased the other also increased.
![]()
INTRODUCTION
Prescription of hearing aids is a common practice in our routine as an effective means of minimizing the disabling effects of different degrees of hearing losses.
Hearing aids are usually amplification sound systems whose primary function is to compensate electronically the hearing losses.
The most significant breakthrough in the area was the creation of the transistor in 1947, which enabled the development of more powerful hearing aids1.
Considering that: high power hearing aids are able to generate, in the 2cc coupler, SPL of 125 to 140dB and that the amount may be l0dB elevated when it reaches the ear; and that according to the Occupational Safety and Health Administration (OSHA) the maximum allowed sound pressure levels are 115dBHL, tolerated for fifteen minutes or less without posing, risks to the hearing; and that the daily mean use of hearing aids in children is 12.4 hours a day18 and in adults it is 13.9 hours a day20, it is easy to admit the potential risk of using hearing aids under such conditions.
The likelihood of experiencing a hearing loss induced by hearing aid use, or rather, by the overamplification provided by them, has become a concern since their launch.
A number of studies conducted in this field, especially in the 50's and 60's, confirmed or dismissed the hypothesis.
Ross and Lerman27, in a review of the literature, found studies published in the Russian literature in 1952 and 53. Later, in a similar article wrote by Jerger and Lewis11, we found a new review of results of studies about the likelihood of having a hearing loss induced by hearing aid use, from 1957 to 1968.
All investigations listed in the two reviews were conducted with the same strategy, to wit: retrospective study of audiometric thresholds shifts in regular users of hearing aids.
Among the investigations listed by Jerger and Lewis11, three of them dismissed the idea that a hearing aid could cause a hearing loss or aggravate it because they did not observe significant differences in auditory thresholds of aided ears25,2,3. Two of them confirmed the presence of significant threshold shifts in aided ears and attributed them to hearing aid use21,16.
Ross and Lerman27, although they had found minor alterations in audiometric thresholds of aided ears, did not attribute them to the use of hearing aids, although they had been emphatic in recommending precaution when fitting powerful hearing aids.
Recently, Humes and Bess8 summarized the studies conducted since the first article about the topic, especially those that used temporary threshold shift as a paradigm of the reduced potential of auditory sensitivity, and demonstrated that there is a definite risk to hearing caused by overamplification of hearing aids.
Similarly to what happens to noise-induced hearing loss (NIHL), shifts attributed to overamplification of hearing aids may be temporary or permanent.
Temporary threshold shift (TTS) are transient shifts of auditory thresholds that are manifested after a short exposure to moderate intensity sounds8. These shifts depend on physical variables of acoustic stimuli (intensity, duration, and frequency), as well as inherent susceptibility of each individual. The necessary intensity to trigger temporary threshold shifts varies depending on the frequency of the sound stimulus. It is defined as the effective quiet level (EQL), the highest sound pressure level of a noise that never produces significant temporary threshold shift and does not delay its recovery if it is produced by exposure to a high intensity sound. For wide band sounds, including speech spectrum, the intensity is normally 7619 to 7824 dBHL.
TTS increases exponentially during the first hours of continuous exposure to noise, until a determined stabilization level, reaching an asymptote. This phenomenon is known as asymptotic threshold shift (ATS) and it is reached in average 8 to 12 hours after continuous or intermittent exposure 22.
In normal ears, once the noise has ceased, TTS (AST) will reduce and thresholds will gradually resume their normal baseline levels.
Mills et al.23 observed that growth and recovery of TTS or ATS in human ears may be described as a simple exponential function, with constant growth and recovery times.
The interest in studying TTS started 45 years ago, after a statement made by Temkin, in 1933, apud Humes and Bess8. The researcher suggested that temporary threshold shifts (TTS) observed after a short exposure to moderate intensity sounds could provide a simple measure to estimate the susceptibility of normal ears to permanent hearing losses resulting from prolonged exposure or exposure to intense sounds.
TTS measured two minutes after cessation of noise exposure (TTS2) has been the damage index most studied in noise-induced hearing losses, although it does not seem to be adequate for all types of noise and exposure.
According to Jerger and Cahart10, the reason for using TTS as an index of susceptibility surged from the consensus that permanent hearing losses would be related to transient shifts of threshold resultant from fatigue of the auditory system. Auditory fatigue is a reflex of the intolerance of the hearing system when exposed to high sound pressure levels. Repetitive or continuous harmful sound exposure, without the necessary time to recover integrally the system, may generate permanent hearing losses4.
In our study, we used prospective methods to study the auditory threshold shifts in subjects with sensorineural hearing loss of different degrees, which may occur daily with the continuous use of hearing aids.
The main purpose of our study was to define occurrence, magnitude and behavior of auditory threshold shifts in a group of patients with bilateral sensorineural hearing loss, recently fitted with unilateral hearing aids, and its correlations with severity of hearing loss and amplification of fitted hearing aid.
MATERIAL AND METHOD
Sample: We evaluated 27 patients, both genders, ages ranging from 8 and 49 years, seen at Ambulatory Hospital Regional da Zona Sul.
The criteria for inclusion in the study were: moderate to profound sensorineural hearing loss; residual hearing in the aided ear audiometrically measured in at least two of the frequencies between 500 and 6.000Hz; recent user of unilateral analog hearing aid; patient with no evidence of external or middle ear disorders in both ears; ability to respond precisely to acoustic stimuli in the pure tone audiometry, ,The patients selected used BTE hearing aids, of different brands and models, fitted by professionals from different services.
Equipment: Audiometer Maico MA 41, coupled to a pair of earphones TDH 39, calibrated by ANSI 1969 standard; digital immitanciometer, brand Grason Stadler model GSI 38; Aurical Audiodiagnostic Fitting System, by Madsen, integrated to software NOAH, coupled to a Pentium processor; digital dosimeter brand CEL model CEL 420; calibrator model CEL 282, application software dB 10.
Method: Each patient was followed up during a period that ranged from 47 to 81 days and they were submitted to weekly or quarterly tests in order to measure auditory thresholds before and after variable periods of continuous use of hearing aid, under controlled conditions of noise exposure. Both ears were included in the study: the ear that had fitted aid formed the aided experimental group, whereas the other ear formed the control group.
Two assessments were performed on the same day: The 1st Assessment (pre-use) was always performed in the morning, after acoustic rest (the patient was asked not to use the hearing aid within 14 hours from the scheduled time), and before the patient started to use the hearing aid that day. It comprised two pure tone audiometry assessments, conducted in sequence, one right after the other; earphones were removed and put on again for both ears between the two exams. The 2nd Assessment (post-use) was conducted the same day, sometime after continuous use of the hearing aids, which were regulated to a predetermined volume and maintained so whenever the patients came to new tests. In order to control noise exposure conditions during the time that they used continuously the hearing aids, we asked them to remain in the ambulatory facility. After a variable period of exposure, the hearing aid was removed and the patient was maintained in the sound treated booth before we conducted two more sequential audiometries. The same procedure was repeated whenever the patient came to new tests.
Since possible alterations of auditory thresholds vary from person to person depending on time and sound pressure level of exposure22,24, we used a digital dosimeter to control the variables, recording time and variation of noise sound pressure level inside the ambulatory while the patients kept their hearing aids. The dosimeter was started up right after the first evaluations and switched off before the second assessment of the day.
It was important to measure the sound pressure level to which the patients had been exposed while using the hearing aids, so that we could know the average input sign captured by the hearing aids, and later we could estimate the output in sound pressure level that would be present in the external auditory canal of each patient after the sign was amplified by the hearing aid. It was also essential to determine output sound pressure level, because this variable was the main factor that influenced shifts of hearing thresholds.
Technique: Pure tone audiometry was conducted in a sound treated booth. We used pure tone pulses produced at 5dBHL intervals, in intensities that varied from - 5 to 120dBHL. In order to define thresholds, we used the ascending-descending technique. We assessed the following frequencies, always in the same presentation order: 1.000, 2.000, 3.000, 4.000, 6.000, 8.000, 500, 250. Audiometries of the second assessment of the day were conducted two minutes after removal of hearing aids and cessation of noise.
In situ measures: They were performed in a regular room, the patient positioned in the middle of the room seated one meter from the loudspeaker, at 0/0 azimuth angle. We used real ear aided response (REAR) to measure sound pressure level, and adopted the acoustic stimulus of frequency modulated pure tone (Warble) produced at 70 dBSPL, plus Input/ Output ratio to measure acoustic gain, using pure tone stimulus in frequencies 500, 1.000, 2.000, 3.150 and 4.000 Hz, produced at 70dNSPL. The 70dB intensity was chosen as an auditory stimulus for in situ measures because it was within the average of sound pressure level measures for the ambulatory environment, and it could better imitate the average input acoustic sign captured by the hearing aids used.
Dosimeter: The dosimeter we used had a dynamic range of 50 to 120SPL, and it had been calibrated at 113.6dBSPL. The microphone was maintained in a fixed position close to the opening of the aid microphone. All measures were obtained usine a frequency filter type A, slow response time and correction factor q=3. The dosimeter was activated when all hearing aids were put on by the patients and then switched off before the second assessment. We tried to change its position so that we could come up with an average value that would reflect the average noise in dBSPL to which the whole group had been exposed throughout that period.TABLE 1 - Mean of auditory threshold for the first and second assessments - control group.
RESULTS
We analyzed the sequential audiometries of the first and second assessments of 27 ears of the control group and 27 ears of the aided group, in frequencies 500, 1.000, 2.000, 3.000, 4.000 and 6.000 Hz. First, we tried to detect if there were significant shifts between the second (post-use) and the first (pre-use) assessments in each group. The difference in dB obtained from the subtraction of hearing thresholds of the second assessments and the thresholds of the first assessment, by frequency, was named absolute difference, and we considered positive absolute difference when the thresholds of the second assessment were higher than the ones of the first, and negative when the thresholds of the second assessment were lower than the ones of the first assessment.
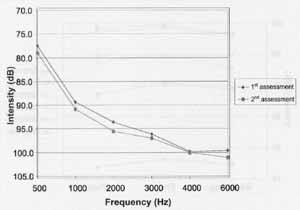
Considering the significance level of 5%, we found statistically significant differences of hearing thresholds in frequencies 500, 1.000, 2.000 and 6.000 Hz for the control group (Table 1, Graph 1), and in frequencies 1.000, 2.000, 3.000 and 4.000 Hz for the aided group (Table 2, Graph 2).
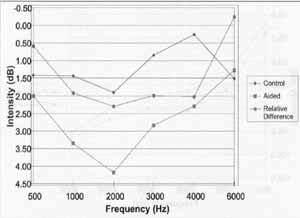
We compared the absolute differences between the two groups. We named this piece of information reduction and relative difference was the difference per frequency obtained by the subtraction of absolute differences of the aided and the control groups. We considered positive relative difference if the absolute difference of the aided group was higher than the control group, and negative if the absolute difference of the aided group was lower than the control group. For a significance level of 5% we found statistically significant relative differences in 1.000, 2.000, 3.000 and 4.000 Hz (Table 3, Graph 3).
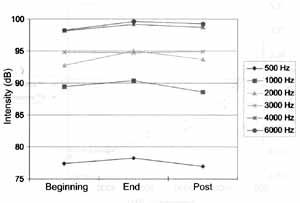
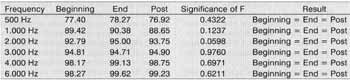
In order to study the behavior of hearing threshold shifts observed in the two groups, we compared auditory thresholds in the first analyzable test of each individual, before (pre-use) and at the end (post-use) of a continuous period of use of hearing aids, and hearing thresholds obtained after acoustic rest (pre-use) in the subsequent test. Therefore, we analyzed for each ear of the aided and control groups three different measures: measures of hearing thresholds of the first assessment (beginning), measures of hearing thresholds of the second assessment (end) obtained on the same day, and the measure of hearing thresholds of the first assessment (post) obtained in the subsequent test.
In the control group (Table 4, Graph 4), we did not observe statistically significant difference among the three measures in any of the assessed frequencies.
In the aides group (Table 5, Graph 5), there was a general increase in thresholds between the beginning (pre-use) and end (post-use) situations, followed by restoration of hearing thresholds in the post situation (rest), and there statistically significant differences (F<0.05) in frequencies 1.000, 2.000 and 3.000HZ.
The correlation between severity of hearing loss and alterations of hearing thresholds for the control group was negative in all frequencies, low in 500, 1.000, 2.000, 3.000, 4.000 Hz and moderate in 6.000 Hz. For the aided group, it was negative in 1.000, 2.000, 3.000, 4.000 and 6.000 Hz, positive in 500 Hz and low in all frequencies.
We also analyzed the correlations between hearing threshold shifts and amplification of hearing aids in the aided group. The correlation of these two variables measured by input/output was positive for the frequencies 500, 1.000, 2.000 and 3.000 Hz, negative in 4.000 Hz and low in all frequencies; the amplification measured by REAR was positive in 500 and 1.000Hz, negative in 2.000, 3.000, 4.000 and 6.000 Hz and low in all frequencies.TABLE 2 Mean of auditory thresholds for the first and second assessments - aided group.
Graph 1. Means of audiometry per frequency in the first and second assessments - control group.
Graph 2. Means of audiometry per frequency in the first and second assessments - aided group.
DISCUSSION
In the present study, the pared analysis enabled subjects to be used as their own controls, reducing the variables that could interfere or hinder the assessment.
Considering that temporary threshold shift (TTS) increases progressively as a result of duration of noise exposure and reaches its maximum after eight hours of continuous exposure, we did not reach the asymptote (AST), because the mean exposure time recorded by the dosimeter was 6 hours and 8 minutes.
The presence of statistically significant shifts in the control group, in 500, 1.000, 2.000 and 6.000 Hz was not expected, since level of equivalent noise (Leq), measured in the place, was 78.8 dBHL, a value very close to the effective quiet level (EQL) for wide band noises, including the spectrum present in our ambulatory (speech spectrum). Similar results were obtained by Macrae and Farrant21, Macrae14, who found the presence of mild degeneration in unaided ears, of unknown origin, according to their own conclusions and the studies by Kinney13, Barr and Wendenberg2 and Ross & Lerman27; however, no special comments were made by the authors concerning the findings.TABLE 3 - Reduction.
Graph 3. Reduction.
Graph 4. Auditory thresholds by frequency measured at beginning, end and post situation -control group.
Upon observing Graph 3, we could notice that the absolute differences in both groups followed the same response pattern; a hypothesis that we raised is the possibility of transmission of part of the sound energy generated in the aided ear to the unaided ear in the same individual. Since output sound pressure levels generated in the aided ears reached values close to 140dl3SPL as shown by in situ measures, even after discounting interaural attenuation, there would be enough sound pressure level to reach the contralateral ear. Thus, by aditivity, it would maximize the direct action of the external noise over it, elevating hearing thresholds. Another possibility could be attribute it to efferent auditory pathway.
Considering that differently from what was observed in the aided group, we could not confirm statistically the transient character of the shifts, possibly because they were small; further studies are necessary to clarify these findings.
In the aided group, we noticed statistically significant threshold shifts in 1.000, 2.000, 3.000 and 4.000Hz and absence of difference in 500 and 6.000Hz. Macrae15,16,18,19,20 found also temporary threshold shifts in different frequencies in severe sensorineural hearing loss in children who used hearing aids. The relative differences were in general positive, except for 6.000Hz, meaning that in the aided group although there has been threshold shifts in the frequency after use of hearing aid, they were lower than in the control group. Macrae17 observed that temporary threshold shifts in aided ears occur in a wide range of frequencies; however, they are less marked in high frequencies, which was also observed by other authors, such as Harford and Markle6, Sataloff28 and Esser5 - who also attributed this fact to the elimination of resonance of the auditory external canal, caused by the hearing aids.TABLE 4 - Auditory thresholds at beginning, end and post situations - control group.
TABLE 5 - Auditory thresholds at beginning, end and post situations - aided group.
Graph 5. Auditory thresholds by frequency measured at beginning, end and post situations - aided group.
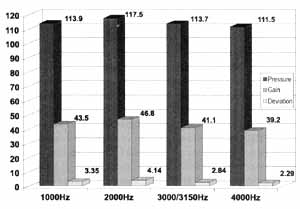
Graph 6. Correlation of hearing aid amplification and deviation of auditory thresholds in statistically significant frequencies.
According to them, at that time, these effects were not known and were not appropriately compensated in the hearing aids fitting. Once the elimination of natural resonance is attributed primarily to the loss of insertion caused by the adaptation of the auditory mold, we believe that it is better to justify the occurrence of few alterations of thresholds at 6.000Hz based on the reduction of amplification and high frequency range of the hearing aids of our sample, because elimination of natural resonance caused by auditory mold would have an effect in frequencies close to the resonance peak of the external ear 26. The absence of statistically significant thresholds shift in 500Hz found in our data may be justified by the fact that many patients in this sample used some form of low frequency attenuation. Ten patients used lowpass filter (N/H) and four of them had vent molds. Another justification would derive from the studies by Humes and Schwartz9 and Humes and Bess8, who obtained low measures of temporary threshold shift obtained post-exposure to noise in frequencies below 1.000Hz because they had underestimated the real damage caused to the hair cells by the action of noise.
The correlation between severity of hearing loss and threshold shifts observed in the two groups was generally low, which did not enabled us to guarantee that there is a correlation between the two. However, the negative value found in almost all frequencies indicated the behavior of the correlation, showing that one increases, whereas the other tends to decrease. The frequency of 6.000HZ in the control group was the only in which we found a moderate correlation severity/shift. In the investigation of threshold shifts, this frequency was also statistically significant for the control group, opposed to the result of the aided group. This fact - the absence of significant shift in this frequency in the aided group - made us wonder if it should be attributed to the use of hearing aids, because by preventing high frequencies from being amplified, it acted as a protecting filter, avoiding affection of frequencies by the action of noise. Maybe this is one of the reasons why there is no predominant loss in high frequencies in temporary or permanent threshold shifts resulting from overamplification of hearing aids, differently from NIHL, in which they are the most affected frequencies and the first ones to be impaired. It is also important to observe that both in the control group and in the aided group we found smaller differences in frequencies the had worse mean hearing loss: 4.000Hz (99.90dB/0.26dB) in the control group and 6.000Hz (94.38 dB/1.27dB) in the aided group. A negative correlation of severity and alteration of threshold was found in the study by Macrae and Farrant21: - 0.60 (most powerful aid) and 0.53 (least powerful aid), and also in the studies by Ross and Lerman (1967)27, who studied permanent hearing losses (-0.60).
Humes and Bess8, using temporary threshold shifts found in frequencies of 1.000 and 4.000Hz of aided ears and measured after acoustic stimulation with continuous noise for about one hour, obtained a correlation of -0.781 for 1.000Hz and -0.870 for 4.000Hz.
The correlation of amplification of hearing aids and hearing threshold shifts in the aided group was not statistically significant either. The positive values found in the measures of acoustic gain and negative values found in the measures of output sound pressure level did not statistically confirm the correlation or the definition of its trend. However, by analyzing Table 6 and Graph 6, we could see that the average values of temporary threshold shifts in all studied frequencies increased proportionally with the increase of in situ measures of sound pressure level and acoustic gain. In some studies, this positive correlation of temporary or permanent threshold shifts and amplification of hearing aid was shown both in pathological18 and in normal7 ears. Ross and Lerman27 found low correlation (0.21) when comparing permanent shifts of thresholds in a group of 18 patients aided unilaterally, with maximum output of their hearing aids in frequencies 500, 1.000 and 2.000 Hz, as specified by the technical manual of the manufacturer.
CONCLUSION
The present study led to the following conclusions: 1. There are shifts in hearing thresholds of aided and unaided ears of patients who have sensorineural hearing loss during the use of hearing aids.
2. The hearing threshold shifts in the aided ear were higher than the shifts of hearing thresholds in the unaided ear of the same individual.
3. The shifts observed were temporary in the aided group. 4. The correlation of hearing threshold shifts and severity of loss was low in both groups. Negative values of correlation observed for most frequencies for both groups and the ratio higher thresholds/lower shift observed when searching threshold shifts for the control and aided groups, may suggest the trend of the relation between these two variables, showing that one increases, whereas the other tends to decrease.
5. The correlation of temporary threshold shifts and amplification of hearing aids evaluated by two in situ measures (REAR and signal/noise ratio) was low in all frequencies. Although the correlation has not been statistically confirmed, frequencies obtained for the aided group and average of amplification of hearing aids obtained with in situ measures for corresponding frequencies, allowed us to observe a relation between the two variables: one increases and the other also tends to increase.
REFERENCES
1. ALMEIDA, Katia de.; IORIO, Maria Cecília Martinelli. - Próteses auditivas: histórico a avanços tecnológicos. In: Próteses auditivas, fundamentos teóricos & aplicações clínicas. São Paulo, Lovise, 1996. 17-46.
2. BARR, B.; WEDENBERG, E. - Prognosis of perceptive hearing loss in children with respect to genesis and use of hearing aid. Acta Oto-Laryngol, 59, 462-72, 1965.
3. BELLEFLEUR, PA.; VAN DYKE, R.C. - The effects of high gain amplification children in a residential school for the deaf. J. Speech. Hear. Res, 11, 343-7, 1968.
4. DURRANT, JOHN D.; LOVRINIC, JEAN H. - Introduction to psychoacoustics. In: Basis of hearing science. 2 ed., Baltimore, Willians & Wilkins, 1984. 214-61.
5. ESSER, G. - Additional auditory damage through hearing aids in severely hearing-impaired children. In: VORTRAGE DES PADAUDIOLOGISCHEN SYMPOSIUMS, Mainz, 1983. Padaudiologie aktuell. Mainz, 1984. 137-44.
6. HARDFORD, E.R.; MARKLE, D. M. -The atypical effect of hearing aid on one patient with congenital deafness. Laryngoscope, 65, 970-2, 1955.
7. HUMES, LARRY E. - Temporary threshold shift result from hearing aid usage. J. Acoustic. Soc. Am, 63, S65, 1978, apud HUMES, Larry E.; BESS, Fred H., 46, 3-15, 1981.
8. HUMES, LARRY E.; BESS, FRED H. - Tutorial on potential deterioration in hearing due to hearing aid usage, J. Speech. Hear. Res, 46, 3-15, 1981
9. HUMES, LARRY E.; SCHWARTZ, D.M. - The effect of overstimulation on the onset of overload and auditory threshold. Scandin. Audiol., 6, 13-7, 1977.
10. JERGER, JAMES F.; CARHART, RAYMOND. - Temporary threshold shift as an index of noise susceptibility.J. Acoustic. Soc. Am., 28, 611-3, 1956.
11. JERGER, JAMES F.; LEWIS, NEIL. - Binaural hearing aids: are they dangerous for children? Ann. Otol. Rhinol. Laryngol., 101, 480-9, 1975.
12. KINNEY, C.E. - Hearing impairments in children. Laryngoscope, 63, 220-6, 1953.
13. KINNEY, C.E. - The further destruction of deafened children's hearing by the use of power hearing aids. Ann. Otol. Rhinol. Laryngol., 70: 828-35, 1961.
14. MACRAE, JOHN H. - Deterioration of the residual hearing of children. Acta Oto Laringol., 66, p.33-9, 1968.
15. MACRAE, JOHN H. - TTS and recovery from TTS after user of powerful hearing aids. J. Acoustic. Soc. Am., 43, 14456, 1968.
16. MACRAE, JOHN H. - Recovery from TTS in children with sensorineural deafness. J. Acoustic. Soc. Am., 44, 1451, 1968.
17. MACRAE, JOHN H. - Permanent threshold shift associated with overamplification by hearing aids. J. Speech. Hear. Res., 34, 403-14, 1991.
18. MACRAE, JOHN H. - Temporary threshold shift caused by hearing aid use. J Speech. Hear. Res., 36, 365-72, 1993.
19. MACRAE, JOHN H. - An investigation of temporary threshold shift caused by hearing aid use. J. Speech. Hear. Res, 37: 227-37, 1994.
20. MACRAE, JOHN H. - Temporary and permanent threshold shift caused by hearing aid use. J. Speech. Hear. Res, 38: 949-59, 1995.
21. MACRAE, JOHN H.; FARRANT, R. H. - The effect of hearing aid on the residual hearing of children with sensorineural deafness. Ann. Otol. Rhinol. Laryngol., 74, 409-19, 1965.
22. MELNICK, WILLIAN. - Human temporary threshold shifts (TTS) and damage risk. J. Acoustic. Soc. Am., 90, 147-154, 1991.
23. MILLS, JOHN H.; GILBERT, ROBERT M.; ADKINS, WARREN Y - Temporary threshold shifts in humans exposed to octave bands of noise for 16 to 24 hours. J. Acoustic. Soc. Am., 65, 1238-48, 1979.
24. MILLS, JOHN H.; GILBERT, ROBERT M.; ADKINS, WARREN Y - Temporary threshold shift produced by wideband noise. J. Acoustic. Soc. Am., 70, 2, 390-6, 1981.
25. NAUNTON, RALPH F. - The effects of hearing aid use upon the user's residual hearing. The Laryngoscope, 67, 569-76, 1957.
26. POLLACK, MICHAEL. - Special application of amplification. In: Amplification for the hearing-impaired. New York, Grune & Stratton, 1980. 255-307.
27. ROSS, MARK; LERMAN, JAY - Hearing aid usage and its effect upon residual hearing. Arch. Otolaryngol., 86, 57-62, 1967.
28. SATALOFF, JOSEPH. - Pitfalls in routine hearing testing, Arch.. Otolaryngol., 73, 717-26, 1961.
29. WARD, W DIXON; CUSHING, E. MARION; BURNS, EDWARD M. - Effective quiet and moderate TTS: implications for noise exposure standards. J. Acoustic. Soc. Am.,59, 1605, 1976.
* Speech and Hearing Therapist, Master in Sciences at Faculdade de Medicina da Universidade de São Paulo.
** Full Professor of Otorhinolaryngology at Faculdade de Medicina da Universidade de São Paulo.
This study is part of the Master Degree Thesis presented at the Department of Experimental Pathophysiology at Faculdade de Medicina da Universidade de São Paulo.
Study presented at 35° Congresso Brasileiro de Otorrinolaringologia, which was awarded a special citation.
Address for correspondence: Rua Abílio Soares, 233 - cjt° 22 - 04005-000 São Paulo/SP - Tel/Fax: (55 11) 3889-8844 - E-mail: audiclin@cepa.com.br
Article submitted on August 15, 2000. Article accepted on October 20, 2000.
Print: ![]()