

Year: 2003 Vol. 69 Ed. 4 - (5º)
Artigo Original
Pages: 464 to 470
 PDF PT
 Vocal intensity variation: a study of vocal folds vibration in humans with videokymography
Author(s):
Henry U. Koishi1,
Domingos H. Tsuji2,
Rui Imamura3,
Luiz Ubirajara Sennes4
Keywords: vocal folds, kymography, vibration, voice acoustic
Abstract:
The increase of glottal resistance is the main mechanism to increase vocal intensity at low fundamental frequency. This increase is due to adductory forces provoked by the contraction of intrinsic laryngeal muscles that increases tension and approximates the vocal folds to the midline. However, the same behavior can be observed in functional disorders, like adductor spasmodic dysphonia and hyperfunctional dysphonia, even during soft phonation. Aim: To evaluate the vibratory pattern of the vocal folds in subjects with normal voice according to intensity variation, in order to establish standard values for the vibratory cycle phases. These values may improve the diagnosis and the follow up of those disorders. Study design: Clinical prospective. Subjects and Methods: Fifty-eight adults were evaluated during habitual (soft) and loud phonation. Vocal folds vibration patterns were analyzed with videokymography. Vocal intensity variation was studied with acoustic analysis software, comparing the intensity levels during habitual phonation and loud phonation. Results: The results showed a spontaneous fundamental frequency (F0) rise as vocal intensity grew and a decrease of the open quotient at loud intensity phonation. Conclusion: Sound intensity levels were established at habitual (63,46 dB) and loud phonation (72,55dB). Open quotient (OQ) values were also established for those intensity phonation levels.
![]()
INTRODUCTION
Vocal emission is an extremely common phenomenon that is part of the daily lives of all people, but getting to know the details of the physiological mechanism is still very complex and challenging1, 2.
Stevens3 reported that physiologists, engineers and physicists were intrigued with the interaction of non-linear mechanisms that were found in vocal fold vibration. He also reported that these structures are able to take different forms and biomechanical characteristics, which can generate infinite combinations of sounds.
This great versatility in sound production can be attributed to some properties of the human vocal folds, such as extremely precise neuromuscular control and great malleability of the structures, resulting from specific histology characteristics 4, 5.
Ishizaka and Matsudaira6 stated that phonation parameters such as frequency, duration, vocal quality and intensity can suffer fine tuning, according to the vocal fold vibration pattern. They reported that for such fine tuning, it is necessary to coordinate some factors such as:
a) subglottic air pressure;
b) airflow going through the glottis;
c) glottic resistance;
d) vocal fold muscle contraction;
e) glottic closure pattern (complete and glottic chinks);
f) vibration mass, rigidity and elasticity of vocal fold;
g) acoustic coupling of cavities above and below the vocal fold (resonance cavities).
Such factors act simultaneously during phonation 7. However, deviation from such parameters sometimes lead to distortions from vocal pattern and are resent in various diseases that cause damage to vocal quality.
Many times, such vocal disorders are intimately related to vocal intensity disorders, causing abnormalities of sound intensity (loudness). Isshiki8,9, upon studying vocal intensity disorders, concluded that glottic resistance is the main mechanism involved in the control of vocal intensity in low frequencies.
In some diseases such as vocal fold paralysis in paramedial position, it is noticed that there is glottic resistance, increase in airflow, low subglottic pressure, reduction of vocal intensity 10, 11. Similar affections can also be observed in other conditions, such as Parkinson's disease and senility 12.
Conversely, in hypertonic dysphonia and adduction spasmodic dysphonia we can observe even during low intensity vocal emission, excessive contraction of adductor muscles, increase in glottic resistance with evident increase of time in which the vocal folds remain in contact with the medline and reduction of the time in which they remain apart13, 14. This vibration cycle pattern in hyperfunctional cases had already been described by Wendler15, in a study with videostroboscopy, a method of examination that continues to be important in supporting the diagnosis of these cases, but that depends on the subjective interpretation of the examiner.
Such affections of the vibration cycle can also be present in some situations of normal phonation. To prolong the time in which the vocal folds remain in contact (closed step) is one of the physiological mechanisms of increased glottic resistance, an important factor to elevate vocal intensity. The closed phase mechanisms can then be present during normal vocal emission in high intensity, but it is not associated with any disease.
In view of the subjectivity of videostroboscopy interpretation and some characteristics of the vibration cycle that are present both in normal emission and in some diseases, there is the need for an objective method that allows quantification of the precise diagnosis and the definition of guidelines for treatment of functional dysphonias, according to the evolution.
The purpose of the present study was to use videokymography to assess the variations of vocal folds in normal subjects in two different intensity situations, during habitual conversational emission (low) and as loud as possible.
Thus, we studied:
a) variation of vocal intensity;
b) variation of fundamental frequency during intensity variation;
c) duration of open and close phase of the vibration cycle of the vocal fold;
d) OQ - opening quotient.
MATERIAL AND METHOD
The study was conducted after being approved by the Committee of Ethics in Research of the Outpatient Division of Otorhinolaryngology, Hospital das Clínicas, Medical School, University of Sao Paulo, and the private practice of the authors.
We included 58 adult subjects that came to ENT assessment complaining of nasal function, such as clinical pictures of rhinorrhea, sneezes, sinus pathologies and allergies, and they agreed to take part in the vocal assessment. The exclusion criterion was presence of history of dysphonia, previous pulmonary diseases, vocal tract surgeries and auditory complaints. In this group of subjects, 35 were female and 23 were male subjects, ages ranging from 18 to 64 years.
The subjects were submitted to telelaryngoscopy and later to laryngeal videokymography. All subjects were previously trained to produce sustained vowel /e/ phonation at different intensity levels, trying to maintain the same vocal emission frequency.
The images (video) and vocal emissions (audio) were recorded simultaneously during the phonation at habitual conversational intensity (low) and as loud as possible.
To record the voice tokens we used a video system coupled to a kymography camera. The study of vibration cycles and vocal emission was conducted using specific computer-based programs for each type of analysis.
Acquisition and recording of images (video)
We conducted telelaryngoscopy of all subjects to rule out the presence of laryngeal abnormalities such as asymmetry, mucosal lesions and glottic chinks that could interfere in the analysis with videokymography. To conduct the procedure, the subjects were asked to sit down and we applied topical anesthesia to the pharynx, using lidocaine 10% solution. We used telescope (laryngoscope) brand Machida, model LY-CS30, adapted to light source Machida, model RG- 2500A and microcamera brand Toshiba, model IK-M41A.
After this step, the selected volunteers were submitted to videokymography. We used videokymography camera brand Kay Elemetrics Corp., manufactured by Lambert Instruments Company in Holland, adapted to the same telescope used in telelaryngoscopy (Figure 1).
Subjects were asked to produce sustained vowel emission /e/ in two specific conditions. One, low speech intensity and the subjects were asked to produce it at speech habitual intensity, simulating a habitual conversation in a noise-free environment. The other phonation, at the loudest level possible, in the same type of modal register, trying to maintain the same phonation frequency and avoiding hypertonic pattern during phonation (supraglottic constriction and compression of vocal folds). We then started recording the images in a videokymography format.
This sequence of images was recorded in S-VHS tape with a Panasonic video model GT4W NV-FS90, in system NTSC.
Recording of phonation (audio)
For sound recording, we used omnidirectional microphone with flat response brand Sony, model ECM T110, connected to the same video device used for recording the images. The microphone was fixed to a headset so that we would keep a fixed distance of 5 cm from the mouth.
The devices were calibrated according to the technique described by Finnegan16. We used white noise produced by a FM radio station, at constant and uniform intensity, a decibel meter brand Bruel and Kjaer model 2230, sound recorder of program Windows and the computer-based acoustic analysis program Multi Speech model 3700, produced by Kay Elemetrics Corp. in the United States.
The microphone and the decibel meter were placed side by side and the same distance from the sound source (FM radio station), which generated an unknown intensity noise (measured by the decibel meter). The signal of the microphone was adjusted through the intensity control of recording of the video device (rec level) and recorded in S-VHS tapes. This audio signal, corresponding to the reproduction of the S-VHS tape, was recorded by the computer through an output connection of the video device (audio out) and the input port of the microphone, located in the sound board Sound Blaster Live of the computer.
We conducted different recording always maintaining the same characteristics of the sound source, but with different recording sensitivity levels (rec level), up to the point that the sound recorder of Windows and Multi Speech program presented a similar value to that of the sound intensity recorded by the decibel meter.
Analysis of images with videokymography
The sequences of videokymography recorded for each subject (case) in the conditions of vocal intensity (habitual and loud) were selected and we excluded the parts in which there was asymmetry of amplitude or vibration irregularity. Later, we digitalized them with an image board brand Voodoo, model 3dfx Visual Reality TV Turner.
We maintained many vibration cycle parameters and calculated the quotients proposed by Hirano17 (1975), described next:
a) Closed phase time (TFF): interval in which the vocal folds remain in contact.
b) Open phase time (TFA): interval in which the vocal folds do not touch.
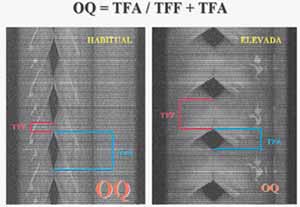
c) Opening Quotient (OQ): TFA / TFA + TFF.
The measures of time of the vibration cycle were conducted by means of a count of number of lines generated by the kymography device in the register. As the kymography records 7812.5 lines per second, it was possible to relate the number of lines with time intervals (Figure 2).
To facilitate the analysis, we created an instrument of measurement, a type of ruler, in Corel Photo software, in the same bitmap jpg format, with the same resolution and dimension of the digitalized image files. To create the instrument, we adopted the model proposed by Figueiredo18.
Analysis of intensity and frequency of phonation
To analyze the intensity and fundamental frequency (F0) of the vocal emission, we selected the sequences recorded in S-VHS tapes in both conditions of intensity (habitual and loud), which were identical to the videokymography images already digitalized for the case.
The audio signal corresponding to each portion was digitalized, making adjustments to the control of the sound recorded volume of Windows.
These files were exported to the acoustic analysis program Multi Speech, model 3700, produced by Kay Elemetrics Corp.
The stored signal was pre-processed, removing the initial and end unstable portions, standardizing the signals with approximately three seconds of duration. Each sample was separately evaluated, considering the intensity in dB SPL and frequency in Hz.
Statistical analysis of data
After the collection of results, we compared the many videokymography parameters considering the male and female studied groups. We compared the variations of parameters during vocal emission in habitual intensity and loud phonation.
The quantitative variables were presented descriptively in tables containing means and standard deviations.
The multivariate technique of the profile analysis was used to study the variables.
The values of p<0.05 were considered statistically significant.
RESULTS
Variation of intensity
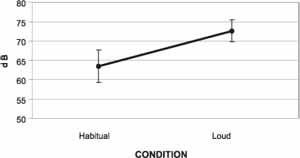
Sound intensity in dB SPL had a significant increase between habitual condition and loud condition in both genders (p=0.0001). The general means were 63.46 dB for the habitual and 72.55 dB for the loud intensity. There was no statistically significant difference between the means concerning gender (p=0.622), and the profile of means for both genders was parallel (p=0.3635). The variation of vocal intensity in habitual and loud phonation is related in Graph 1.
Variation of frequency
There was increase in fundamental frequency in both genders in loud phonation (p=0.0014 for the female group and p=0.0001 for the male group). The means of females ranged from 209.34 Hz (standard deviation of 43.31) to 238.65 Hz (standard deviation of 32.02), in habitual and loud intensity, respectively. For the males, the means ranged from 138.80 Hz (standard deviation of 25.82) to 223.44 Hz (standard deviation of 32.57) for the same conditions.
Vibration cycle phases
There was increase in TFF in both genders between habitual and loud intensity. In TFA, there was reduction in both genders in loud phonation.
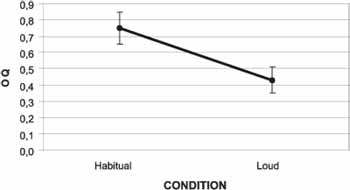
It was noticed that OQ reduced between habitual and loud phonation for both genders (p=0.0001), which did not produce statistically significant difference in variation of means between genders (p=0.3661) in both phonation conditions. The general means were 0.75 in habitual condition and 043 in loud condition. The general findings are related in Graph 2.
Figure 1. Kymography camera and laryngeal telescope.
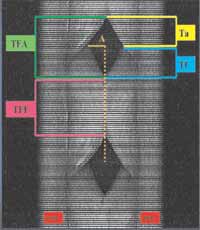
Figure 2. Videokymography image representing the phases of the vibration cycle.
TFF: Closed phase time
TFA: Open phase time
Ta: Opening time
Tf: Closing time
A: amplitude
Figure 3. Representation of the reduction of OQ (reduction of TFA and increase of TFF).
Graph 1. Variation of vocal intensity in dB.
Graph 2. Reduction of OQ with increase of vocal intensity.
DISCUSSION
During habitual conversation, vocal folds vibrate at high speed, reaching 200 cycles per second or more. To access details of this rhythm of vibration, special features are required for the exams. Therefore, we can count on devices such as stroboscopy, high-speed cameras, electroglottography, photoglottography and stroboscopic RX.
Considering all of them, stroboscopy is probably the most well-known and used in clinical routine, presenting good quality images and relative easiness of interpretation, because it shows the laryngeal anatomy quite precisely.
Despite those qualities, stroboscopy presents some limitations such as difficulty to evaluate objectively and in details the vibration cycles of vocal folds. The use of high speed filming with ultra-fast cameras rules out such limitations, allowing the assessment of the different phases of a single vibration cycle in real time. However, this type of filming requires sophisticated and expensive devices, making it impossible to be used in clinical practice.
Videokymography allows recording of the vocal fold vibration in a conventional video system NTSC and in ultra-speed when the kymographic mode is activated. The conventional video system NTSC provides only 30 frames (images) completed per second; the videokymography mode generates 7812.5 images of the same line (the first line of the monitor) in one second 19.
In the present study, we used videokymography and assessed the values of OQ at different levels of vocal intensity, representing different grades of vocal fold tension. Therefore, there was affection of glottic resistance, which represents one of the control mechanisms of vocal intensity. This increase in glottic resistance is obtained mainly by contracting the thyroarytenoid muscle (TA), which causes increase in tension and medial compression of the vocal folds.
There was significant reduction of OQ with increase in vocal intensity, agreeing with the data obtained by Slavit20 and Yanagi21 (Figure 3). However, such results do not agree with the values presented by Bohadana22, which did not detect changes in OQ with increase of F0 in the excised human larynges, in which there was cricothyroid approximation by increase in vocal fold tension. Such behavior reinforces the idea that vibration cycle abnormalities in physiological conditions can not be attributed simply to isolated muscle contraction, but rather to interaction and joint effect of various mechanisms.
To record vocal samples, the distance from the microphone in relation to the sound source is an essential point in standardization, and it should be maintained the same for all analyses, even though there is no standard distance. Kitajima and Gould23 positioned the microphone 20cm from the mouth of patients in their study; Larsson24, upon assessing patients with vocal tremor, defined the microphone 30cm distant from the mouth, and Araújo25 placed the microphone 5 cm away from the mouth in the study to define the normal range for computer-based acoustic analysis parameters.
In our study, the computer-based acoustic analysis program was run only to objectively assess the variation of vocal emission intensity and frequency, without performing spectrographic analysis.
The results of our study showed mean intensity of habitual phonation of 63.75 dB for female subjects and 63.01 dB for male individuals. In loud intensity, we observed mean of 72.54 dB for female and 72.55 dB for the male group. This interval of approximately nine decibels is smaller than the one observed by Colton 26. This difference can be attributed to limitation of laryngeal movement, which is imposed during tongue traction to conduct telelaryngoscopy in our study.
Another important factor described by many authors is the correlation between increase in intensity and involuntary increase of F01, 4, 27, 28. The authors explained that physiological mechanisms that regulate those two parameters comprise similar forces. To increase vocal intensity, it is necessary to have an increase in tension and vocal fold contraction forces, which end up causing an increase in the closed phase of the vibration cycle. Conversely, the increase in tension also causes increase in F0. Many muscles can exercise such forces, but the most expressive ones are the TA and the cricothyroid (CT) muscles 2. In our study, the increase in intensity was followed by involuntary increase of F0, despite the instructions provided to the subjects to try to maintain the same frequency in both conditions (habitual and loud).
The mean for females in habitual phonation was 209.34 Hz and 238.65 Hz in loud phonation. In the male group, this difference was even greater, with 138.80 Hz in habitual phonation and 223.44 Hz in loud phonation. This larger increment in males may be explained by the fact that men have lower F0 than women, and upon elevating intensity, they can not notice the change in frequency. Women, conversely, are more used to controlling this variation, since they present F0 normally higher and tend to avoid vocal emissions that are too high.
Hacki13, using electroglottography and comparing patients with laryngeal hypertonia in a control group, observed values of OQ very similar to our results. In this group of healthy subjects, he observed OQ of 0.70 for habitual emission and 0.48 for maximum intensity. He noticed for hypertonic dysphonia cases reduction of the open phase of the vibration cycle, even in low intensity phonation. In loud emission, he described greater reduction of OQ when compared to the control group.
Similar results were obtained by Köster29, using ultra-fast taping and electroglottography, presenting variation of OQ of 0.60 to 0.64 during vocal phonation in habitual intensity.
The minor differences in OQ between the present study and Hacki13 and Köster29 results can be explained by differences in applied methods. To conduct an eletroglottography, there is no need to visualize the vocal folds, that is, it does not require laryngoscopy and prevents the modifications of the vocal tract positioning during the introduction of the telescope. Despite this disadvantage, videokymography allows more detailed study of the anatomy, allowing visualization of vocal fold movements, correlating them to vocal emission affections in a simultaneous fashion.
The standardization of OQ values and vocal intensity can not only help in diagnosis of diseases such as spasmodic, hypertonic and Parkinson's dysphonia and vocal fold paralysis, but also allow observation of vocal abnormalities that occur as a result of the aging process, providing better understanding of presbyphonic complications.
In addition to diagnosis, such values can support the treatment of adduction spasmodic dysphonia. In our clinical experience, we have observed good results treatment the disease with botulinum toxin injections of the thyroarytenoid muscle. However, there is no objective standard that defines the exact moment when a new application can prevent the recurrence of symptoms. Knowing the normal values of the vibration cycle of the vocal folds concerning vocal intensity, we can identify precisely those moments in which there is no concordance between vocal intensity produced and the values of OQ found.
CONCLUSIONS
1) The means of vocal intensity were 63.46 dB for habitual phonation and 72.55 dB for loud phonation.
2) There was involuntary increase of fundamental frequency during elevation of vocal intensity. The increment was more evident in male subjects.
3) There was significant reduction in opening quotient (OQ) with increase in vocal intensity. The means were 0.75 for habitual phonation (63.46 dB) and 0.43 for loud phonation (72.55 dB).
ACKNOWLEDGEMENT
To FAPESP, for the support in purchasing the equipment required for the present study.
REFERENCES
1. Hirano M. The laryngeal muscles in singing. In: Hirano M, Kirchner JA, Bless DM. Neurolaryngology: Recent Advances. San Diego, CA: Singular Publishing Group Inc.; 1991. p.209-30.
2. Titze IR. Current topics in voice production mechanisms. Acta Otolaryngol (Stockh) 1993; 113: 421-7.
3. Stevens K. Physics of laryngeal behavior and larynx modes. Folia Phonet. Basel 1977; 34:266-79.
4. Hirano M, Vennard W, Ohala J. Regulation of register pitch and intensity of voice. Folia Phoniatr 1970; 22:1-20.
5. Hirano M. Morphological structure of the vocal cord as a vibrator and its variations. Folia Phoniatr 1974; 26:89-94.
6. Ishizaka K, Matsudaira M. Fluid mechanical considerations of vocal cord vibration monograph 8. Speech Communication Res Lab 1972; Santa Barbara, CA.
7. Koyama Y, Kawaski M, Ogura J. Mechanics of voice production. In: Regulation of vocal intensity. Laryngoscope 1969; 79:337-54.
8. Isshiki N. Regulatory mechanism of voice intensity regulation. J Speech Hear Res 1964; 7:17-29.
9. Isshiki N. Vocal intensity and air flow rate. Folia Phoniatr 1965; 17:92-104.
10. Isshiki N, Morita H, Hiramoto M. Thyroplasty as a new phonosurgical technique. Acta Otolaryngol (Stockh) 1974; 78:451-7.
11. Tucker HM. Combined laryngeal framework medialization and reinervation for unilateral vocal fold paralysis. Ann Otol Rhinol Laryngol 1990; 99:778-81.
12. Baker KK, Raming LO, Luschei ES, Smith ME. Thyroarytenoid muscle activity associated with hypophonia in Parkinson disease and aging. Neurology 1998; 51:1-10.
13. Hacki T. Electroglottographic quasi-open quocient and amplitude in crescendo phonation. J Voice 1996; 10:342-7.
14. Gibbs SR, Blitzer A. Botulinum toxin for the treatment of spasmodic dysphonia. In: Voice disorders and phonosurgery. Otolaryngologic Clinics of North America 2000; 4:879-94.
15. Wendler J. Die bedeutung der stimmstaerke bei der stroboskopischen untersuchung. Folia Phoniatr 1967; 19:73-88.
16. Finnegan EM, Luschei ES, Hoffman HT. Modulations in respiratory and laryngeal activity associated with changes in vocal intensity during speech. J Speech Lang Hear Res 2000; 43:934-50.
17. Hirano M. Phonosurgery. Basic and clinical investigations. Otologia (Fukuoka) (Suppl 1) 1975; 21: 239-440.
18. Figueiredo LAP. Desnivelamento das pregas vocais- estudo experimental da vibração das pregas vocais através da videoquimografia; 2001. Tese de Doutorado Faculdade de Medicina da Universidade de São Paulo São Paulo; 2001.
19. Tsuji DH, Sennes LU. Videoquimografia da laringe: novo método de avaliação da vibração cordal. Arq Otorrinolaringol 1998; 2:136-40.
20. Slavit DH, Lipton RJ, Mccafrey TV. Glottographic analysis of phonation in the excised canine larynx. Ann Otol Rhinol Laryngol 1990; 99:396-402.
21. Yanagi E, Slavit DH, Mccafrey TV. Study of phonation in the excised canine larynx. Otolaryngol Head Neck Surg 1991; 105:586-95.
22. Bohadana SC. Vibração das pregas vocais pré e pós aproximação cricotireóidea: estudo experimental em laringes humanas excisadas por videoquimografia; 2001. Tese de Doutorado Faculdade de Medicina da Universidade de São Paulo São Paulo; 2001.
23. Kitajima K, Gould WJ. Vocal shimmer in sustained phonation of normal and pathologic voice. Ann Otol 1976; 85:377-81.
24. Larsson H, Hertegard S, Lindestad P, Hammarberg B. Vocal fold vibrations: high-speed imaging kymography and acoustic analysis: a preliminary report. Laryngoscope 2000; 110: 2117-22.
25. Araújo SA, Grellet M, Pereira IC, Rosa MO. Normatização de medidas acústicas da voz normal. Rev Bras Otorrinolaringol 2002; 68:540-4.
26. Colton RH. Vocal intensity in the modal and falsetto registers. Folia Phoniatr (Basel) 1973; 25:62-70.
27. Boe LJ, Rakotofiringa H. A statistical analysis of laryngeal frequency: Its relationship to intensity level and duration. J Speech Lang Hear Res 1975; 18:1-13.
28. Debruyne F, Buekers R. Interdependency between intensity and pitch in the normal speaking voice. Acta Otorhinolaryngol. (Belg) 1998; 52:201-5.
29. Köster O, Marx B, Gemmar P, Hess MM, Künzel HJ. Qualitative and quantitative analysis of voice onset by means of a muiltidimensional voice analysis (MVAS) using high-speed imaging. J Voice 1999; 13:355-74.
11 Post-graduate physician, Discipline of Otorhinolaryngology, Medical School, University of Sao Paulo.
2 Full Professor, Medical School, University of Sao Paulo.
3 Assistant physician, Discipline of Otorhinolaryngology, Medical School, University of Sao Paulo.
4 Full Professor, Medical School, University of Sao Paulo.
Address correspondence to: Henry Ugadin Koishi - Rua da Consolação, 3638 apt 82C Jd. Paulista São Paulo 01416-000
Tel (55 11)5585-9119 - E-mail: henry@osite.com.br
Article submitted on May 06, 2003. Article accepted on July 01, 2003.

Print: ![]()