

Year: 2002 Vol. 68 Ed. 2 - (5º)
Artigo Original
Pages: 182 to 188
 PDF PT
 Characteristics of hoarse, rough and normal voices: acoustic spectrographic comparative analysis
Author(s):
Paulo A. L. Pontes 1,
Vanessa P. Vieira 2,
Maria I. R. Gonçalves 3,
Antônio A. L. Pontes 4
Keywords: spectrography, hoarseness, vocal quality.
Abstract:
Introduction: Vocal quality can be assessed by auditory perceptual and acoustic methods. The terms used to describe vocal quality aren't standardized. However, two of them deserve special attention regarding the parameters that distinguish roughness and hoarseness, both usually called as hoarseness in the literature. Aim: To evaluate comparatively and to define basic differences among hoarse, rough and normal voices using acoustic spectrography. Study Design: Prospective clinical randomized. Material and Method: Six hoarse, six rough and six normal voices sorted by auditory perceptual evaluation, and analyzed by spectrography under five parameters: fundamental frequency (f0), extension of harmonics, definition of harmonics, presence of noise between the harmonics and up them. Results: Hoarse voices presented lower f0, whereas rough voices showed higher f0 in comparison to normal voices. Considering the spectrogram from 0 to 5,4 kHz, the mean value of the uppermost harmonic frequency reached 4.555 Hz for normal voices, 2.125 Hz for rough voices and 1.147 Hz for hoarse voices. Harmonic tracing in hoarse voices showed worse definition and greater amount of noise among and up the harmonics. Conclusions: There are striking spectrographic differences among hoarse, rough and normal voices. Harmonics are present in greater amount and show better definition in normal voices, and decrease in amount in rough and hoarse voices respectively. Inversely, noise appears in great amount and in a diffuse way in hoarse voices and in smaller amount in rough and normal voices.
![]()
INTRODUCTION
Two important resources could be used to assess vocal quality: auditory perception and acoustic analyses.
The first method is subjective and varies according to observers, their personal concepts on vocal quality, perception skills, discrimination and experience.
The second analysis is objective and uses software that quantitatively demonstrates several measurable aspects of the voice signal captured. Acoustic analysis has been increasingly used in Brazil for the past ten years, since studies in this field have recently become more comprehensive. The analysis enables objective voice evaluation in initial speech therapy and follow-up visits, as well as in pre-op and postoperative periods and scientific investigation. One of the main tools of this analysis is spectrography, which visually demonstrates the acoustic characteristics of emission and complements auditory perception analysis. However, information provided by spectrography requires interpretation by the observer.
Spectrography is the translation of sound patterns in graphic visual patterns showing fundamental frequency (f0) and harmonics of a voice, as well as zones of intense loudness in speech. It uses a mathematical analysis known as "Fourier analysis", which determines the sound wave components. This method separates the acoustic wave into its basic components, that is, it exposes frequencies and their respective amplitudes1. Therefore, a spectrogram could be defined as a chart showing the relative loudness of the sound wave components, indicated by darkening or coloring of frequency bands in the vertical axis versus time in the horizontal axis. Through this evaluation, the specialist could infer glottic function during vocal emission. Today this correlation has been made easier by laryngeal image obtained with optical fibers.
The terms related to vocal quality classification vary much and are controversial. There are few standardized terms and, in general, the observers use adjectives related to sense organs, such as clear, rough, dark, vibrating, pale and acid voice, in order to better understand the characteristics of the sound heard. Among the several types of vocal quality considered altered, two deserve special attention as to their distinctive parameters: hoarse voice and rough voice, both generically referred to as hoarseness in the international literature.
Several authors mention roughness, hoarseness and dysphonia in a undefined fashion as if they were the same vocal alteration2,3,4,5.
In spite of confusion and polemics related to vocal quality terminology, considering the conceptual point of view, it is of paramount importance to distinguish between hoarse and rough voice in Portuguese.
Hoarse voice has a noisy characteristic, with frequently reduced pitch and loudness, whereas in rough voice the sound causes an unpleasant, or even irritating, sensation6. Rough voice is also defined as a psychoacoustic impression of irregular vocal fold vibrations, that is, it corresponds to irregular fluctuations in fundamental frequency and/or in amplitude of the source of glottic sound2.
There are no precise or reasonable definitions of normal voice characteristics. According to Casper & Colton7, there are no defined patterns or limits related to this type of voice. Greene & Mathieson8 characterized the normal voice as a common voice, presenting nothing special in its sound. Moore9 stated that the criterion to classify voices as normal and altered is determined by listeners, and vocal disorders have cultural bases and social determinations.
These concepts should have a differentiated spectrographic translation, because when authors try to identify parameters to define hoarseness, they do not explain differences between the two types of voice.
Thus, the objective of this study is to comparatively analyze by means of spectrography hoarse, rough and normal voices, which were previously selected by the auditory perception method.
MATERIAL AND METHOD
Eighteen adults were studied and divided into 3 groups: normal, hoarse and rough voices. Each group was made up of 3 male adults and 3 female adults; age range was 20-45 years in all 3 groups. The mean age among men with hoarse voice was 35 years, with rough voice, 34.6, and normal, 30. The mean age in the female group with hoarse voice was 39.6 years, with rough voice, 37, and with normal voice, 34 years (Chart 1).
The cases were selected from videotapes of laryngological examinations using a rigid telescope, carried out in the Institute of the Larynx- INLAR, São Paulo. The study was submitted to the Research Ethics Committee, Federal University of São Paulo - UNIFESP/EPM for approval.
The following equipment was used for these examinations: Multidirectional microphone; Digital cassette tape SONY 60 LP-90; Digital videocassette tape SONY model DHR 100. The examination was recorded in a silent environment, with the microphone 15 cm away from the mouth, during emission of sustained vowel /e/ in normal conditions. Two speech therapists and two otorhinolaryngologists experienced in this type of assessment selected the voices. Apart from presence of hoarse voice and rough voice, the selection criterion for altered voices was grade 3 impairment in a loudness evaluation ranging from 1 to 3; in that, 1= mild, 2= moderate and 3= extreme. The individuals with normal voice did not have vocal complaints and presented "clean" voice, with no alterations. The definition of hoarse voice was noisy voice, contrasting with smoothness and harmonic sensation of a normal voice. Pitch and loudness are usually decreased in this type of voice and noise is present. We considered rough the voice with a rude and not melodious characteristic, with unpleasant and even irritating emission and with pitch variation6. As to normal voice, we selected voice with socially acceptable quality, not interfering in speech understanding and presenting frequency, loudness, modulation and projection that are adequate for gender and age of the speaker10. The listeners had no disagreement during selection of emissions.
After recording and selection, the voices were transferred to a Macintosh-compatible PC, with a 7.5 system, using SoundScope software developed by GW instruments.
The software SoundScope generates data output as a spectrogram. To perform this assessment we used a 1-second sustained voice emission, 0.0 kHz-5.4 kHz frequency range in the spectrogram, and 4.0 V amplitude in the oscilloscope. A 59-Hz low-pass filter was used in the spectrogram.
It was necessary to change gain in the software for some voices so that loudness would be always within the pre-established 4.0-V limit. This modification was designed to standardize loudness in spectrograms, enabling a comparative analysis of harmonics and noises. Hence, standardization of loudness during emission was avoided, what would cause change in vocal production.
Distinctive parameters related to sound wave and noise were used for this study and considered the main vocal quality components.
Sound-wave related parameters:
· Automated analysis of f0;
· Harmonic extension: frequencies with highest harmonics in a non-interrupted presentation; upper harmonic frequency was defined as a multiple of f0, and it coincides with its region in the spectrum;
· Definition of harmonics.
Noise-wave related parameters:
· Presence of noise in the harmonic region;
· Presence of noise in the region above the harmonics.
The results were submitted to simple statistical analysis - percentage and arithmetical mean.
RESULTS
The results are shown in Tables 1 to 5.
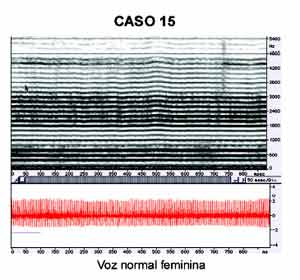
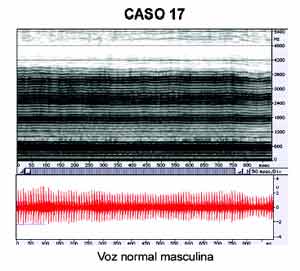
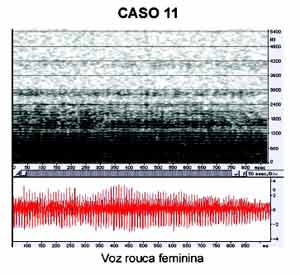
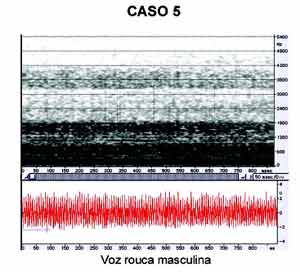
Table 1 demonstrates the results of f0 computerized analysis. We observed that hoarse voice presented very low f0, whereas rough voice presented very high values, that is, high when comparing with normal voice and genders.
As to upper harmonic frequency values shown in Table 2, hoarse voice presented low averages if compared with rough voice by gender, and both types of voice presented a very low range as compared with normal voice.
Analyzing the harmonic tracing definition (Table 3), all hoarse voices presented poorer definition than normal and rough voice.
Concerning harmonic-to-noise ratio, Table 4 shows that rough voice presented smaller amount of noise than hoarse voice, that is, this region is less grayish in rough voice than in hoarse voice.
Finally, Table 5 displays amount of noise in the region above the harmonics and its results were very similar to those shown in Table 4, since hoarse voice also presented more noise in this region than rough voice.
Chart 1. Distribution of cases by gender, age and vocal quality classified through auditory perceptual method.
Table 1.
Table 2.
Table 3.
Table 4.
Table 5.
DISCUSSION
Depending on the language and culture, the terms used to qualify voice vary not only as words, but also as semantic fields. Each language has adjectives to describe normal and altered vocal quality.
In this study we chose two groups among the altered types of voice that are perceptually different and referred as hoarse and rough voice, according to Behlau & Pontes6. To select normal voice we used the definition by Behlau et al10.
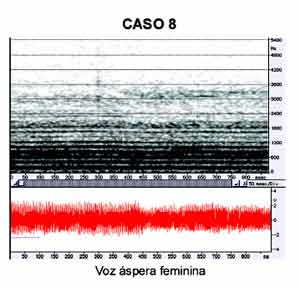
We observed harmonics in all spectrograms; in that, hoarse voice presented fewer harmonics and a not well defined tracing, due to noise and probable f0 variation. In only one female voice a better definition of harmonics was observed, but with much darkening of the region among them. A study carried out by Hiraoka et al11 also acoustically demonstrated the difference between hoarse and normal voice through harmonics.
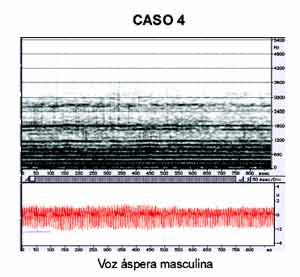
In males, the expected normal f0 average (Table 1) is 113 Hz12; however, we found 183.6 Hz in male rough voice, that is, a frequency much higher than the normal value; in hoarse voice, there was a slight decrease to 106.6 Hz. Inversely, in females, f0 dropped to 136.3 Hz in hoarse voice, a significant decrease in relation to the expected normal value of 207 Hz12; whereas f0 in rough voice increased to 234.0 Hz. In other words, hoarse voice presented lower f0, and rough voice higher f0 than normal voice. Based on these results, we could state that increase in f0 in rough voice in males is as marked as decrease in hoarse voice in females. This behavior could be justified by considering that in conversation spectrum, female and male voices are in opposite positions in the vocal frequency range; therefore, variations within this range are easier than out of its limits. Arnold & Emanuel13, in a study on roughness perception in sustained vowels, also reported increased f0 in 4 out of 10 subjects with rough voice.
The average f0 in male population was 122.0 Hz for normal voice, and this value is close to the average described by Behlau et al12 (113.0 Hz, SD 6.26 Hz). As to females, the average was 219.6 Hz, and it is close to the value reported in the same study (207.8 Hz, SD 4.49 Hz).
In Table 2 we observed that for normal individuals the harmonics fill all or nearly all the spectrogram interval, with an average range in female voices of 4,868.6 Hz, and 4,242.6 Hz in males. This large amount of harmonics expresses greater voice clarity. As to rough voice, these ranges achieved an average of 2,145.6 Hz in females, and 2,104.6 Hz in males, representing virtually half the average in normal voice. In hoarse voice, the upper average was 1,311.6 Hz for females, and 983.3 Hz for males, representing nearly one quarter of the result for normal voice. This poor amount of harmonics could be explained by Fourier's theory. Based on this theory, we could assume that decreased harmonics in high frequencies in rough voice is a consequence of vibrating cycles with different periods and loudness; the lower harmonics have excessive acoustic energy in the spectrogram, and the horizontal line is configured in the time axis. Concerning the upper harmonics, due to aperiodical vibrating cycles, the harmonic moves further at each cycle with decreased loudness, making upper harmonics less defined, that is, the harmonics are no longer observed in relation to time axis because they are in different levels in the frequency axis. As to hoarse voice, there is not only an aperiodical fundamental tone, but also a sum of sounds; therefore, definition of harmonics was lower and range of harmonics was very low.
Likewise, we could explain the configuration of harmonics in Table 3. In hoarse voice the harmonics are very poorly defined, with instability and low amplitude in spectrography, and, in rough voice, definition is moderate and darkening among them is more homogeneous, as observed in Table 4. This darkening in rough voice could be explained according to Omori et al4, who defined the presence of different acoustic abnormalities in some altered voices. They reported low peaks between two consecutive harmonics in spectral power. These peaks are called subharmonics, and could be considered, in this material, the gray band between each harmonic represented in the rough voice spectrography.
In like manner, Nunez et al14 considered subharmonics as low frequency modulations located between two consecutive harmonics in the spectrum. Deal & Emanuel15, in a study on waveform and spectral tracing of rough voice, concluded that larger amplitude variation enables better auditory perception of roughness. Emanuel & Austin16 also selected 20 individuals with normal and rough voice and carried out acoustic analysis. They concluded that the values observed differentiated the perceptually normal and rough voice in a significant manner.
On the other hand, since hoarse voice usually does not provide a good definition of harmonics, the grayish bands are probably just noise overlapping the harmonics (Table 4), and the presence of harmonics in these cases is intense and diffuse.
Tables 4 and 5 show normal cases always presenting reduced noise between the harmonics lines and a very high range of harmonics. This demonstrates better wave periodicity, that is, a nearly periodical wave during the complete emission.
In all cases of altered voice, harmonics were absent above 3.0 kHz. This piece of information may be important to assess altered voice spectrograms because an aperiodical sound wave is not uniformly amplified. It also prevents its multiples from being represented in the graph as harmonic lines according to increase in frequency, making the region above 3.0 kHz darkened just by the presence of noise.
Loudness of recorded emissions is an issue interesting to be evaluated. It was necessary to modify gain in some voices through the program itself so that loudness of analyzed samples would be uniform. This procedure could alter the configuration and loudness of harmonics, which are important parameters in definition of vocal quality and in visual spectrum, but it does not modify the vocal production, which would undoubtedly occur with uniform loudness during emission.
For the next study we suggest maintaining recorded loudness for an accurate visual analysis that could be better compared with the auditory perceptual analysis.
Based on the same rationale, there is opportunity for new studies correlating these vocal qualities with presence, type and grade of laryngeal alterations. Breathiness, which was not addressed in this study, could be also included.
CONCLUSIONS
Based on the spectrographic study comparing three types of voice we concluded that:
· There are marked differences among the types of voice; in that, in normal voice there are many harmonics that reach the higher frequencies of the spectrum, that is, above 3.0 kHz;
· Rough voice has more harmonics and better definition of harmonics than hoarse voice, but less harmonics than normal voice;
· The amount of noise between the harmonic bands is much smaller in normal voice in comparison with rough voice;
· Hoarse voice presents greater amount of diffuse noise throughout, or through most of, the spectrogram.
REFERENCES
1. Baken RJ, Orlikoff RF. Clinical measurement of speech and voice, 2a ed. San Diego: Singular Thomson Learning; 2000. p.225-284.
2. Hirano M. Clinical examination of voice. New York: Springer Verlag; 1981. p.81-4.
3. Mcallister A, Sederholn E, Ternström S, Sundberg J. Perturbation and hoarseness: a pilot study of six children's voices. J Voice 1996;10:252-61.
4. Omori K, Kojima H, Kakani R, Slavit DH, Blaugrund SM. Acoustic characteristics of rough voice: subharmonics. J Voice 1997;11:40-7.
5. Rabinov CR, Kreiman J, Gerratt BR, Bielamowicz S. Comparing reliability of perceptual ratings of roughness and acoustic measures of jitter. J Speech Hear Res 1995;38:26-32.
6. Behlau M, Pontes P. Avaliação e tratamento das disfonias. São Paulo: Lovise; 1995. p.97-8.
7. Casper J, Colton R. Compreendendo os problemas da voz: Uma abordagem Fisiológica para o tratamento dos Distúrbios da Voz. Porto Alegre: Artes Médicas; 1996.
8. Greene M, Mathieson R. The voice and Its Disorders. 5th ed. London: Wurr; 1989.
9. Moore GP. Voice disorders organically based. In: Travis LE. Handbook of speech Pathology and Audiology. New York: Appleton-Century-Crofts; 1971.
10. Behlau M, Azevedo R, Pontes P. Conceito de voz normal e classificação das disfonias. In: Behlau M. Voz: O livro do especialista. Rio de Janeiro: Revinter; 2001. p.53-79.
11. Hiraoka N, Kitazoe Y, Ueta H, Tanaka S, Tanabe M. Harmonic - intensity analysis of normal and hoarse voices. J Acoustic Soc Am 1984;76:1648-51.
12. Behlau M, Tosi O, Pontes P. Determinação da frequência fundamental e suas variações em altura ("Jitter") e intensidade ("Shimmer"), para falantes do português brasileiro. Acta Awho 1985;4:5-9.
13. Arnold KS, Emanuel FW. Spectral noise levels and roughness severity ratings for vowels produced by male children. J Speech Hear Res 1979;22:613-26.
14. Nunez BF, Suarez NC, Munoz P, Baragano RL, Alvarez ZM, Martinez FA. Estudio espectrografico de la disfonia: subharmonicos. Otorrinolaringol Esp 2000;51:52-6.
15. Deal RE, Emanuel FW. Some waveform and spectral features of vowel roughness. J Speech Hear Res 1978;21:250-64.
16. Emanuel FW, Austin D. Identification of normal and abnormally rough vowels by spectral noise level measurements. J Commun Disord 1981;14:75-85.
1 Faculty Professor of Otorhinolaryngology, Department of Otorhinolaryngology and Human Communication Disorders, Federal University of São Paulo - UNIFESP - EPM.
2 Speech and Voice therapist, Specialist in Human Communication Disorders, Federal University of São Paulo - UNIFESP- EPM.
3 Professor, Course of Speech and Language Therapy and Audiology, Federal University of São Paulo - UNIFESP - EPM.
4 Physician, Instituto da Laringe - São Paulo.
Affiliation: Instituto da Laringe - INLAR - São Paulo - Rua Dr. Diogo de Faria, 171 Vila Clementino - São Paulo - Brazil CEP 04037-000 - Tel: (55 11)5549.2188 - Fax (55 11) 5575.7649 - E-mail: vpedrosa@inlar.com.br
Study presented at II Congresso Triológico de Otorrinolaringologia, in Goiânia in August 2001.
Article submitted on January 24, 2002. Article accepted on March 21, 2002.
Print: ![]()