
Year: 2007 Vol. 73 Ed. 5 - (12º)
Artigo Original
Pages: 660 to 670
Hearing aid fitting process in users fitted in a federal public institution: part II - self-assessment questionnaire results
Author(s): Carine Dias de Freitas 1, Maristela Julio Costa 2
Keywords: hearing handicap, hearing disability, hearing aid, questionnaire
Abstract:
An efficient rehabilitation must be able to reduce impairment effects over the auditory and communication skills of individuals and promote psychosocial well being. Aims: check the feasibility of using self-assessment questionnaires and compare the results achieved by hearing aid fitting in users from a federal public institution, with and without complaints related to hearing amplification characteristics. Materials and Methods: 25 individuals, from 13 to 77 years of age, users of hearing aids. The HHIE-S/HHIA (Hearing Handicap Inventory for the Elderly Screening Version or for Adult) and APHAB (Abbreviated Profile of Hearing Aid Benefit) self-assessment questionnaires used with individuals without (Group 1) and with complaints related to amplification characteristics (Group 2). Results: we did not find significant differences between the HHIE-S/HHIA and APHAB groups; except in APHAB's ease of communication item, where Group 1 seemed to benefit more. Moreover, we noticed a significant reduction in hearing disability with the use of hearing aids in favorable communication situations, noisy environments for both groups. Conclusion: these questionnaires proved to be valuable for predicting the difficulties faced by the users, and significant differences were found in favorable communication situations, where the group without complaints had the most benefit.
![]()
INTRODUCTION
Hearing aid selection and fitting process, as well as their effective use, are fundamental in order to start hearing rehabilitation. In order to be considered efficient, it must be able to reduce the effects this disability brings over the auditory and communicative skills of the individual, in other words, his/her auditory disabilities and enhance their psychosocial well-being, thus reducing the disadvantages brought about by the disability or the auditory incapacity, called auditory handicap, a world wide used term by researchers, also used in this study. Moreover, these functional improvements must remain throughout time1.
In order to assess intervention results, the literature describes both objective procedures involving in situ measures, functional gains and formal speech recognition tasks, as subjective ones, which may concurrently show speech recognition and other aspects of life, such as difficulties in communication in daily activities. Thus, it is possible to check if the intervention process has reduced these disabilities or the auditory handicap, as well as check patient acceptance and satisfaction with the hearing aid2.
In order to investigate the individual's performance or his perception of changes that may occur along time, favorable or not in hearing itself or in social or emotional relationships, the use of tools such as interviews and questionnaires are of the uttermost importance, because by using self-assessment questionnaires of disabilities or of auditory handicap, we obtain subjective measures based on the user's judgment or his own perception3.
As referred to in the first part of this study, although many investigations have been carried out with hearing aid users, very few of them are attributed to users fit through the Public Health Care system. Therefore, the second part of this investigation aimed at:
1. Check the feasibility of using self-assessment questionnaires in patients from a public institution;
2. Compare hearing aid use results in users with and without complains related to the amplification characteristics.
MATERIALS AND METHODS
This study was approved by the Ethics Committee of the Project Cabinet of the Health Sciences Center - CCS - UFSM, protocol # 112/2004. All participants signed the Informed Consent form in order to participate.
As it was described in the previous study, we interviewed 31 individuals fitted with hearing aids in the Hearing Aid Laboratory of the Federal University of Santa Maria, through the partnership signed between the State Health Secretariat of Rio Grande do Sul State and the Federal University of Santa Maria, in order to establish a joint action to provide hearing aid for the hearing handicap users of the Public Health Care System-SUS, under protocol 051/2000 signed in 12/29/2000 and published in the Federal Gazette on 02/08/2001, based on Ordinance 432 from the Ministry of Health.
After the interview, we started to assess the intervention results by means of subjective measures, that is, self-assessment questionnaires, which help us check the difficulties experienced in daily communication activities.
We excluded the cases in which the hearing aids were returned (2) and/or who had associated pathologies (4), which could interfere in evaluating the results.
The study group was made up of 25 users, 13 females and 12 males, with ages varying between 13 and 77 years, all of them with symmetric mixed bilateral or sensorineural hearing loss of moderate to severe levels, bilaterally fit with digital or computer-assisted programmable analogical hearing aids.
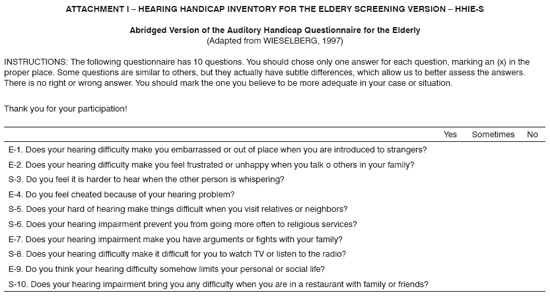
In order to assess communication difficulties and the social and emotional consequences of hearing disability in these users, we used the age-dependent Auditory Handicap self-assessment questionnaires for the elderly in the post-fitting period: Hearing Handicap Inventory for the Elderly Screening Version - HHIE-S (Annex 1), abridged version, developed in 19824 and adapted for the Portuguese Language in 19975 and the Hearing Handicap Inventory for Adults - HHIA (Annex 2) for adults6, adapted for the Portuguese Language in 19982.
Both the HHIE-S and the HHIA are questionnaires made up by two scales: one Social /Situational and the other one is emotional. The first aims at identifying the impact hearing loss would have on the activities performed by the individual, while the second one assesses the behavior and the emotional response to the hearing deficit.
HHIE-S is an abridged version of HHIE4, being faster and of easier understanding to be used in the elderly with hearing disability, made up of 10 questions broken down in five items for each scale. Now, the HHIA was developed from the HHIE to be used in hearing impaired patients with ages below 65 years, made up of 25 items, and 12 of them correspond to the Social/Institutional scale; and the other 13 are related to the emotional one. All the individuals below 65 years responded to the protocol adapted to the Brazilian Portuguese Language HHIA not excluding teenagers and young adults, because these are the only equivalent protocols to be used in different populations according to age range.
HHIA indices are identical to those from the HHIE-S. All the users were required to answer "yes" (4 points), "sometimes" (2 points) or "not" (no point) for each question. The answers obtained from patients with hearing aids were analyzed and the scores found by scale and total were standardized, in other words, turned into percentage indices, indicating its performance for this situation. The score value could vary between 0 and 100%, and the higher the score obtained; the higher was the patient's self-perception of the handicap, 18 to 42% indicated little to moderate perception; and above 42%, indicated severe or significant perception.
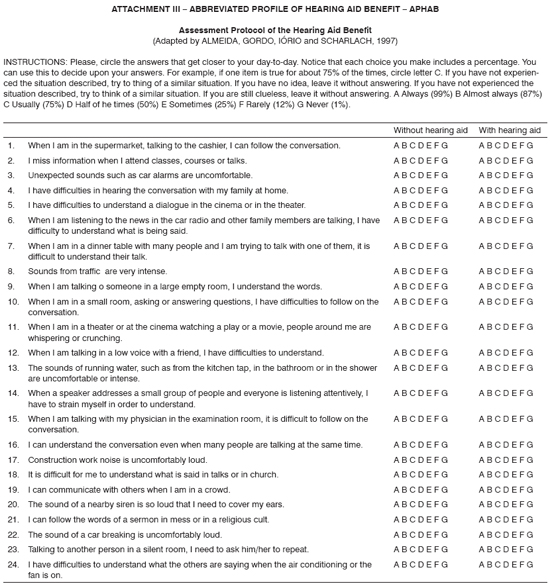
In a second phase, in order to assess hearing aid benefit, we used the Abbreviated Profile of Hearing aid Benefit - APHAB7 (Annex 3) adapted to the Portuguese Language in 19978.
APHAB is a self-assessment questionnaire, useful to quantify the disability associated with the hearing loss and its reduction with the use of sound amplification. It is based on 24 items, distributed in four subscales, namely: Ease of communication (EC), Reverberation (RV) and Environmental Noise (EN), made to assess speech understanding in different situations of our daily lives, and also Sound Aversion (SA), which quantifies the negative reactions to environmental sounds. For each item we offered two answer options, one "without hearing aids" and another "with hearing aids", through which we could assess both the individual's own performance with and without the hearing aid with the benefit supplied by amplification, factoring in the difference between these two indices.
Users were instructed to answer the same item in each subscale, for both options "with" and "without" hearing aids, selecting the answer within a continuous seven points scale (A, B, C, D, E, F, G), which should indicate how frequent each statement was true. Each answer option was associated with a descriptive term and to a percentage, which are: A "always" (99%), B "almost always" (87%), C "usually" (75%), D "half of the time" (50%), and "sometimes" (25%), F "rarely" (12%) and G "never" (1%).
The response from each individual for each of the subscales was analyzed and calculated by means of a computer program "Phonak Fitting Guideline 8.5", indicating its performance for each situation "without" and "with" hearing loss and its benefit, calculating the differences between responses for each situation.
In order to analyze the results attained, considering each subscale individually, it is necessary that we have a minimum difference of 22% between the indices with and without hearing aid in at least one of the subscales to represent a real difference between the two situations. Now, if the goal is to have a global evaluation of amplification, a hearing aid index of 10% better than that without hearing aid in three subscales: FC, RV, and RA, really represents an improvement in the individual's performance9.
The first questions in the questionnaire were asked by the examiner and the following, whenever possible, were answered by the individual being studied. In those users in whom we noticed some type of difficulty, either understanding or expressing written language, the examiner asked all the questions verbally.
We separated the individuals assessed in two groups based on the qualitative results related with the amplification previously investigated, as follows:
Group 1 (G1) - Without complaints related to the amplification characteristics (N=8).
Group 2 (G2) - With complaints related with amplification characteristics (N=15).
Afterwards, the results were statistically analyzed, by using a non-parametric test, which was the Krukal-Wallis test to analyze the statistically significant differences between the situations with and without hearing aids in the APHAB questionnaire and between the two groups by means of HHIE-S, HHIA and APHAB. The level of rejection towards the null hypothesis was fixed in a value equal to or less than 5%. Statistically significant results were marked with an asterisk (*).
RESULTS
1. Handicap Inventory for the Elderly Screening Version - HHIE-S or Hearing Handicap Inventory for Adult - HHIA Results obtained for Groups 1 and 2.
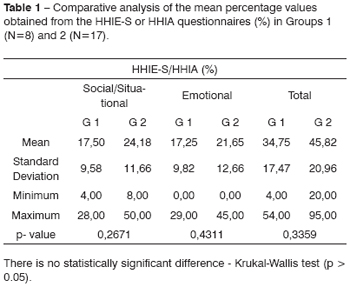
On Table 1 one can see the averages, the standard deviation and the minimum and maximum percentage values per scale (Social/Situational and Emotional) and total, obtained by means of these HHIE-S or HHIA auditory handicap results (%) in a post fitting period, in Groups 1 and 2 like the results of the statistical analysis.
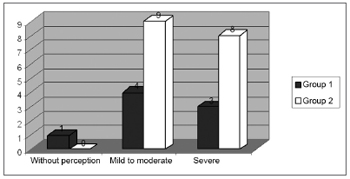
Figure 1 shows the three levels of the auditory handicap perception, according to distribution for the Groups 1 (N = 8) and 2 (N = 17).
Figure 1 - Distribution by degrees of perception of the auditory handicap for Groups 1 (N=8) and 2 (N=17).
2. Abbreviated Profile of Hearing Aid Benefit - APHAB results obtained for Groups 1 and 2.
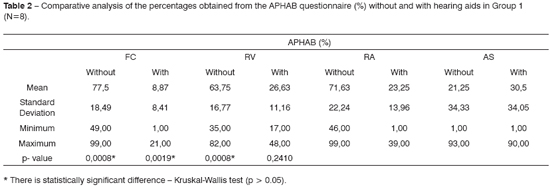
Table 2 shows the averages, standard deviations and minimum and maximum percentage values of auditory difficulties for each subscale: Ease of Communication (EC), Reverberation (RV), Environmental Noise (EN) and Sound Aversion (SA), obtained after hearing aid fitting from the APHAB questionnaire, in those from Group 1 (N = 8), for situations with and without hearing aids, as well as the result from the statistical analysis.
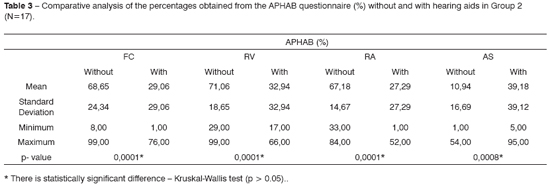
Table 3 shows the averages, standard deviations and minimum and maximum percentage values of the hearing difficulties for each subscale: Ease of Communication (EC), Reverberation (RV), Environmental Noise (EN) and Sound Aversion (SA), obtained after hearing aid fitting from the APHAB questionnaire in those patients from Group 2, for situations with and without hearing aids (N = 17), as well as the result from the statistical analysis.
Table 4 shows the averages, standard deviation and maximum and minimum percentage values regarding the benefit, coming from the difference in results between the situations with and without the hearing aid for each subscale: Ease of Communication (EC), Reverberation (RV), Environmental Noise (EN) and Sound Aversion (SA), obtained after fitting by means of the APHAB questionnaire (%) in Groups 1 and 2, as well as the result from the statistical analysis.
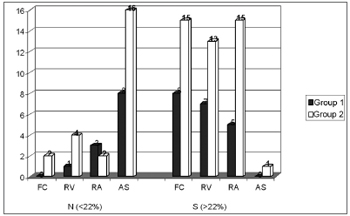
Figure 2 shows the benefit distribution by subscales for Groups 1 (N = 8) and 2 (N = 17).
Figure 2 - Distribution of the benefit by subscale for Groups 1 (N=8) and 2 (N=17).
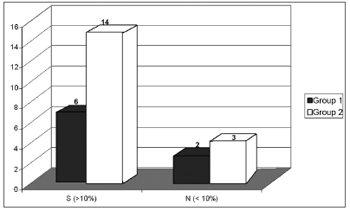
Figure 3 shows the distribution of global benefit, significant (S) or not (N) for Groups 1 (N = 8) and 2 (N = 17).
Figure 3 - Distribution of the global benefit for Groups 1 (N = 8) and 2 (N = 17).
DISCUSSION
1. Comments on the results from the Handicap Inventory for the Elderly Screening Version - HHIE-S or Hearing Handicap Inventory for Adult - HHIA obtained for Groups 1 and 2.
We noticed a 34.75% of average percentage total scale index for Group 1, with a variation range between 4% and 54%. In the social/situational scale we found an average index of 17.50% and in the emotional scale it was of 17.25%. For Group 2, there was an average index for the total scale of 45.82%, varying between 20% and 95%, and from the total, 24.18% corresponded to the social /situational scale and 21.65%, to the emotional (Table 1).
Statistically significant differences for the social/situational scale, emotional and total between the groups were not found when compared to the indices of auditory handicap perception. Nonetheless, we see better results in the social/situational, emotional and total scales for those patients in Group 1 when compared to Group 2, in other words, there is less auditory handicap perception in the group which did not present complaints related to amplification characteristics (Table 1). With this, we notice the importance of utilizing these questionnaires, which make it possible to investigate the patient's perception about his/her own communication difficulties, aiding in monitoring in time and identifying their real auditory needs besides those which are possible to be seen in routine audiologic evaluations10,11.
Of the 8 users who made up Group 1 in this study, 1 (12.5%) did not show any self-perception of an auditory handicap with scores below 16%; 4 (50%) had self-perception of mild to moderate handicap corresponding to an interval of 18 to 42%; and 3 (37.50%) showed a significant self-perception of the handicap imposed by the auditory deficiency and/or disability, with indices above 42% (Figure 1). Meanwhile, of the 17 individuals from Group 2, not one of them had any perception of their auditory handicap3. However, 9 (52.94%) had self-perception from mild to moderate and 8 (47.02%) presented with significant auditory handicap (Figure 1).
Many investigations were carried out in the post fitting period, with the goal of checking the benefit in the long run, of which results from the handicap self-perception found throughout the three years of sound amplification use are similar to those found in the present study, in other words, a mild to moderate perception of the auditory handicap.12-14
According to the aforementioned studies, we notice that the benefit and the satisfaction obtained from sound amplification after a short time interval can show a marked reduction in auditory handicap thanks to the excitement and high user's expectation, however, a real improvement in performance, able to assess amplification limitations must be obtained after at least 3 months of use, which should remain and stabilize with time.
Thus, patient follow up could in fact show treatment efficacy and also check if the amplification would continue being considered beneficial or not1. Thus, these tools, among their many utilities, can be considered useful to check communication problems and/or the psychosocial consequences of hearing loss which remain, even with sound amplification, helping patients through the fitting process, which does not end after checking results, it lasts through time.
2. Comments on the results of the Abbreviated Profile of Hearing Aid Benefit - APHAB obtained for Groups 1 and 2.
On Tables 2 and 3 average percentage indices obtained through the application of the APHAB questionnaire for each subscale, without a hearing aid, which were for Group 1: 77.5% (FC), 63.75% (RA), 71.63% (RV) and 21.25% (AS), and for Group 2: 68.65% (FC), 71.06% (RA), 67.18% (RV) and 10.94% (AS). And for the situation with hearing aids, in Group 1, the average percentage indices observed were less in the subscales, namely: 8.87% (FC), 26.63% (RA), and 23.25% (RV). The same thing did not occur in subscale AS, in which we obtained the worst result with hearing aids equal to 30.5% (Table 2). As far as Group 2 is concerned, average indices with hearing aid were also lower for subscales FC, RA and RV, presenting indices equal to 9.06%, 32.94% and 27.29%, respectively. Subscale AS presented higher values with hearing aid, with average percentage index equal to 30.18% (Table 3).
Therefore, statistically significant differences among he results obtained with and without hearing aids for subscales FC, RV and RA were found for both groups (Table 2 and 3), and performance was better with hearing aids. However, for subscale AS, which encompasses the negative aspects related to environmental sound perception, we did not see statistically significant difference for Group 1 between the two situations (Table 2), while Group 2 revealed a statistically significant difference between the two situations (Table 3), however, performance was worse with hearing aids.
Such results can be expected, having seen that hearing aids aid in verbal communications under favorable conditions and even in not very pleasant communication situations; nonetheless, with high levels or just a mild worsening in subscale AS with hearing aids can be justified by the fact that the acoustic signals become more intense with sound amplification, thus causing negative reactions to environmental sound. Similar findings to these ones were encountered in many studies7,2,15.
The benefit reflected by the use of sound amplification was calculated by the differences between the APHAB questionnaire response for both situations, namely: with and without the hearing aid. Positive benefit values mean that a better performance was seen with hearing aid when compared to those without hearing aid. Conversely, negative values show a perception of a worse performance with hearing aid when compared to without hearing aid.
For Group 1, we found benefit values of 68.62% (FC), 48.38% (RA), 37.12% (RV) and -9.25% (AS) and in Group 2, we noticed indices of 39.59% (FC), 39.88% (RA), 38.12% (RV) and -28.18% (AS), thus showing a significant reduction in hearing loss with the use of hearing aids in favorable communication situations (FC), in reverberating environments (RV) and in the presence of environmental noise (RA) for both groups. As previously stated, in negative perception situations, performance with the hearing aid was worse for both groups, confirmed by negative benefit indices in Subscale AS (Table 4).
By analyzing the results we noticed statistically significant differences between Groups 1 and 2 only in subscale FC, and Group 1 showed the best results. Nonetheless, in non-favorable verbal communications, we had better benefit results in subscale RV for Group 1 when compared with Group 2, and similar results between both groups in subscale RA (Table 4).
In subscale AS we did not find statistically significant differences between average indexes from Groups 1 and 2, nonetheless, it is stressed that Group 1 was the one who had the lowest results, suggesting that the complaints related to the amplification characteristics presented by Group 2 influenced the performance with hearing aids in high intensity environmental sound, because many of the complaints were related to the high intensity of environmental sounds - headaches and discomfort towards sounds.
Different research projects16-23 were conducted in an attempt to investigate and compare the benefit attained by means of applying self assessment questionnaires with different hearing aid technologies bearing different electro acoustic characteristics, though none of them had reported hearing problems after hearing aid fitting with the results found in this hearing impairment self-assessment protocol.
Despite all of this, as we compared benefit results by scale in this study with those from other studies which assessed experienced users, we found for both groups 1 and 2 similar results as far as benefit is concerned equal to 35%7and 41.42%2. In subscale RA, the results we found are higher when compared to those found in the first study mentioned, which was 36.74%, Group 1 showed higher results, and Group 2 showed similar results. In favorable communication situations, only Group 2 presented benefits similar to 42.89%2, which is higher when compared to 31%7. Group 1 showed higher benefit rates when compared to the ones aforementioned. We believe that this is related to the fact that Group 1 was well adapted and without complaints related to amplification characteristics.
We found negative results in the aforementioned studies as far as the sound aversion scale is concerned, representing the worst results found in this study when compared to those from Group 1, and when compared to Group 2 they are similar to -30%7 and greater than -18.11%2.
We recommend that the indices of subscale AS be the lowest possible, that is, closer to zero, indicating that the sound amplified by the hearing aids should not be uncomfortably loud, because we believe that this subscale can provide information about adapting the maximum output of these hearing aids, although new investigations are necessary to use it in a proper and precise way. 9 With this, we can explain the fact that Group 1 presented indices closer to zero when compared to Group 2, since these patients do not complain about the amplification characteristics, which is different from Group 2, very likely because the complaints reported presented higher negative values, which are far from the ideal.
As we perform an individual analysis of the benefit's results, we observed a difference higher than 22%, showing a significant benefit per subscale in 100% (8), 87.5% (7) and 62.5% (5) of users from Group 1 in the respective subscales FC, RV and RA. On the other hand, no significant benefit was obtained from the SA subscale for this Group. Now, 83.33% (15) of Group 2 users presented effective benefits in subscales FC and RA, 72.23% (13) for RV, 5.56% (1) for subscale SA (Figure 2).
In the Global assessment, a real performance improvement, that is, an index with hearing aid that was 10% better than the index without hearing aid in the three subscales FC, RV, and RA was seen in 75% (6) of those patients from Group 1; 2 users had benefits above 10%, in 82.35% (14) of the individuals who made up Group 2, and the other two presented lower benefits only in subscale RV, and a third one without significant benefits in the three subscales (Figure 3).
Thus, the APHAB questionnaire proved to be an excellent tool, not only o assess the benefit obtained from the use of amplification, but also to predict and confirm the user's performance when in difficulty of communication in different situations, which still remain despite the use of amplification, thus contributing in adjusting amplification throughout the process, because as we can see in this study, the rehabilitation process is directly linked to the expectations and perceptions of the user herself, and this is the keystone in the hearing aid fitting process.
The aim of the hearing aid fitting process is to offer environment sound amplification and mainly the sounds of speech in a satisfactory and proper manner. Nonetheless, even with amplification, some communication difficulties may depend on hearing loss type, level and configuration, as well as disabilities and auditory handicap experienced by the patient. Therefore, such aspects not only have to be taken into account, but also challenged together with the future user, so that a high expectation with rehab does not impair the real benefit obtained with amplification.
Once again, we stress that the use of these protocols in the pre and post fitting periods, since they proved to be excellent predictors of the difficulties faced by the users of hearing aids, could also help in adjusting the device based on the user's own perception, however in a quantified and standardized way, often times by means of spontaneous questions - these users feel intimidated or unable to reveal their own difficulties.
By the same token, even if the prescribed acoustic gain values are reached or the speech recognition tests show improvements in speech recognition, the self-assessment questionnaires must be used, since an increase in hearing and/or speech recognition do not guarantee a reduction in the hearing disability handicap the patient experienced. We also consider that the education and advice stage, as well as long term advising, is mandatory to assure a successful rehabilitation, soothing out the difficulties that may eventually slow down treatment progress.
CONCLUSION
At the end of this study, a critical appreciation of the results led us to conclude that:
1. The self-assessment questionnaires proved to be excellent predictors of the difficulties faced by the users of hearing aids, and they could also help in hearing aid fitting;
2. Significant differences between the groups studied in the self-assessment HHIE S and HHIA protocols, as well as in the APHAB were not found, except in the ease of communication subscale, in which Group 1, without complaints related to amplification characteristics obtained greater benefits.
REFERENCES
1. Weinstein BE. Treatment efficacy: hearing aids in the management of hearing loss in adults. J Speech Hear Res 1996;39(5):S37-S45.
2. Almeida K. Avaliação objetiva e subjetiva do benefício de próteses auditivas em adultos (Dissertação). São Paulo: Universidade Federal de São Paulo/Escola Paulista de Medicina; 1998.
3. Ventry IM & Weinstein BE. The hearing handicap inventory for the elderly: a new tool. Ear Hear 1982;3:128-34.
4. Wieselberg MB. A auto-avaliação do handicap em idosos portadores de deficiência auditiva: o uso de HHIE (Dissertação). São Paulo: Pontifícia Universidade Católica de São Paulo; 1997.
5. Newman CW, Weinstein BE, Jacobson GP, Hug GA. The hearing handicap inventory for adults: psychometric adequacy and audiometric correlates. Ear Hear 1990;11(6):430-3.
6. Cox RM & Alexander GC. The abbreviated profile of hearing aid benefit. Ear Hear 1995;16(2):176-83.
7. Matas CG & Iório MCM. Verificação e validação do processo de seleção e adaptação de próteses auditivas. In: Almeida K & Iório MCM. Próteses auditivas: fundamentos teóricos & aplicações clínicas. 2ª ed. São Paulo: Lovise; 2003. p.305-20.
8. Almeida K. Avaliação dos resultados da intervenção. In: Almeida K & Iório MCM. Próteses auditivas: fundamentos teóricos & aplicações clínicas. 2ª ed. São Paulo: Lovise; 2003. p.335-53.
9. Cox RM. Administration and application of the APHAB. Phonak Focus. 1996; 21:1-12.
10. Johnson CE, Danhauer JL, Krishnamurt S. A holistic model for matching high-tech hearing aid features to elderly patients. J Am Acad Audiol 2000;9:1-12.
11. Bess FH, Hedley-Williams A, Lichtenstein MJ. Avaliação audiológica dos idosos. In: Musiek FE & Rintelmann WF. Perspectivas atuais em avaliação auditiva. São Paulo: Manole; 2001. p.343-70.
12. Humes LE, Halling D, Coughlin M. Reliability and stability of various hearing-aid outcome measures in a group of elderly hearing-aid wearers. J Speech Hear Res 1996;39(5):923-35.
13. Humes LE, Garner CB, Wilson DL, Barlow NN. Changes in hearing-aid benefit following one or two years hearing-aid use by older adults. J Speech Hear Res 2002;45(4):772-82.
14. Humes LE & Wilson DL. A examination of changes in hearing-aid performance and benefit in the elderly over a 3-year period of hearing-aid use. J Speech Hear Res 2003;46(1):137-45.
15. Almeida K & Taguchi KT. Utilização do questionário na auto-avaliação do benefício das próteses auditivas. Pró-Fono 2004;16(1):101-10.
16. Gordo A. Estudo comparativo do desempenho de próteses auditivas com circuito K-AMP e processamento digital do sinal. (Dissertação). São Paulo: Universidade Federal de São Paulo/Escola Paulista de Medicina; 1998.
17. Scharlach RC. Estudo comparativo do desempenho de próteses auditivas com circuito K-AMP e limitações por compressão. (Dissertação). São Paulo: Universidade Federal de São Paulo/Escola Paulista de Medicina; 1998.
18. Bortholuzzi SMF. Estudo comparativo do desempenho das próteses auditivas analógicas e digitais em indivíduos adultos (Tese). São Paulo: Universidade Federal de São Paulo/Escola Paulista de Medicina; 1999.
19. Ferrari DV & Bevilacqua MC. Comparação do desempenho entre aparelhos auditivos digital e híbrido - parte II: percepção da fala. Pró-Fono 2003;15(1):85-94.
20. Bucuvic EC. Avaliação subjetiva das dificuldades auditivas e do benefício da amplificação em pacientes novos usuários de aparelho auditivo (Dissertação). São Paulo: Universidade Federal de São Paulo/Escola Paulista de Medicina; 2003.
21. Parra VM. Processamento temporal e benefício da amplificação sonora (Dissertação). São Paulo: Universidade Federal de São Paulo/Escola Paulista de Medicina; 2003.
22. Cox RM, Alexander GC, Gray GA. Audiometric correlates of the unaided APHAB. J Am Acad Audiol 2003;14(7):361-71.
23. Ricketts T, Henry P, Gnewikow D. Full time directional versus user selectable microphone modes in hearing aids. Ear Hear 2003;24(5):424-39.
1 M.S in Human Communication Disorders Sciences - Federal University of Santa Maria - UFSM/RS, Speech and Hearing Therapist and Substitute Professor of Speech and Hearing Therapy of the Federal University of Santa Maria - UFSM/RS.
2 PhD in Human Communication Disorders Sciences/Speech and Hearing Therapy - Federal University of São Paulo - UNIFESP/SP. Speech and Hearing Therapy Adjunct professor of the Speech and Hearing Therapy - UFSM/RS.
Dissertation entitled "Results and Implications of the hearing aids fitting process in users seen in a federal public institution " presented in the Master's Degree Program in Human Communications Disorders - Speech and Hearing Therapy - Federal University of Santa Maria (UFSM, RS), as a partial requirement to obtain the titel of Master's in Sciences in Human Communications Disorders 2006. Presented as an update program in the XXI International Meeting of Audiology, held in Bauru - SP, 2006.
Send correspondence to: Carine Dias de Freitas - R. Tuiuti, nº 1840 Bloco B/apto 203 Santa Maria RS 97015-662.
Tel. (0xx55) 3026-5482 ou (0xx55) 9159-1017 - E-mail: carine_freitas@yahoo.com.br.
Paper submitted to the ABORL-CCF SGP (Management Publications System) on July 25th, 2006 and accepted for publication on August 25th, 2006. cod. 3299.
