
Year: 2003 Vol. 69 Ed. 1 - (17º)
Artigo Original
Pages: 93 to 99
High-frequency audiometry: study with normal audiological subjects
Author(s):
Daniela R. Sahyeb, 1;
Orozimbo A. Costa Filho, 2;
Kátia de F. Alvarenga, 3
Keywords: audiometry, audiology
Abstract:
Recent research studies pointed to High-Frequency Audiometry (HFA) as a tool for early diagnosis of hearing impairment caused by the main etiological agents, such as aging, exposure to ototoxic drugs, and occupational noise.
AIM: Although there are already several techniques developed for this assessment, some of them should not be applied to clinical routine, because of their lack of practicability and, sometimes, lack of reliable results. According to the literature, a suitable methodology for such assessment, as well as values indicated as normal reference, are still needed.
STUDY DESIGN: Clinical prospective.
MATERIAL AND METHOD: The present research study observed auditory thresholds in young and audiologically normal individual with HFA and assessed some variables that could have an influence upon the results.
CONCLUSION: Based on the collected data, we were able to established values for mean, standard deviation and median, besides minimum and maximum values for each frequency, for the entire population. Statistical analyses did not identify significant differences between gender and the ears. Moreover, questions related to inter-and intra-individual variability are discussed.
![]()
INTRODUCTION AND LITERATURE REVIEW
Up to the 70's, the interest in the sensitivity of the human ear to high frequency sounds was not evident, considering the conclusions of studies at that time, which revealed that occasional early damage to the hearing system was identified by assessing the frequency of 8kHz1, 2, 3.
However, more recent studies investigated the possibility of assessing hearing sensitivity in a wider frequency range (higher than 8kHz), and it brought new perspectives related to early diagnosis of recent hearing damage resulting from degenerative etiological agents, such as aging, exposure to ototoxic drugs and high noise levels.
Despite the existence of equipment to conduct high frequencies pure tone audiometry (8-20kHz), studies have not demonstrated yet a consensus concerning the importance of these sounds, but they approached topics such as reliability of calibration standards, limitations of the equipment, the methodologies used, and the results found. Such comments demonstrated scarcity of knowledge in the areas of normalization and pathology.
To the present, the results found in audiologically normal subjects showed evidence of excellent hearing sensitivity for high frequency sounds in children4-7. Other authors6, 8-15 studied adults and showed a tendency of decrease in sensitivity with aging.
Gender variability has been widely addressed, especially in studies related to the population with some kind of hearing loss, or the elderly. According to the literature13-16, women have frequently shown better hearing sensitivity than men for high frequency sounds. However, in a young and audiologically normal population, recent research results did not show significant differences in this comparison.
The difficulty to find precise results led to the development of various assessment techniques. It is clearly perceived that some procedures, created to solve inter and intra-subject variability and acoustic variability in high frequency assessments would be feasible for research purposes, but do not apply as a procedure for early diagnosis in clinical practice, in which assessment and techniques should present good result reliability and easy applicability.
Difficulties related to audiological assessment with high frequency sounds
Despite the fact that decrease in hearing sensitivity by frequency is a tendency, as reported by some authors6, 17, 18, others have warned us that instability of results may not be due to intrinsic individual factors, such as those related to the methodology employed. Thus, they pointed out that the criteria that characterize the selected population, the techniques used for equipment calibration and test conduction, the environmental characteristics of the test and the response criteria of the tested subject may increase variability of results among subjects of the same age, the same age range, or even the same subject in different tests. The authors advised that special cares are required to compare findings in studies related to normalization and pathology.
The difficulty in positioning the earphones is due to the presence of acoustic and biological variability and it occurs because when there is ¼ of wave length getting close to the length of the external auditory canal (EAC), resonance and stationary waves are produced, alternating the initial tested signal and hindering the precise measure of the sound pressure level close of the tympanic membrane.
It frequently happens with frequency sounds above 3lHz. However, above 15kHz, half the wavelength is already enough to produce such resonance in the transversal dimensions of the external auditory canal. Thus, throughout the whole meatus, there is no a uniform wave shape with stability of sounds pressure level up to the tympanic membrane. Variations of approximately 15-20dB are not rare in these cases and can result from minimum modifications of earphone positioning.
Taking into account that the tympanic membrane is at an angular position at the end of the EAC and at different degrees in each subject, and taking into consideration the geometry of the acoustic canal, the sound wave distribution is understood as even more irregular1, 2, 3, 19, 20, 21.
Thus, it is necessary to collect current and consistent information about the behavior of these thresholds in audiologically normal subjects and test reliability, from hearing loss detection, monitoring and, especially in sensorineural pathologies, whose onset generally affects higher frequencies first.
The purpose of the present study was to observe high frequency hearing thresholds in audiologically normal subjects analyzing acoustic inter and intra-subject variability that may result in interference of test results.
MATERIAL AND METHOD
This study was conducted at Centro de Distúrbios da Audição, Linguagem e Visão, Hospital de Reabilitação de Anomalias Craniofaciais (CEDALVI-HRAC-USP), approved by the Research Ethics Committee of the hospital.
We assessed 50 subjects (24 male and 26 female subjects) in the age range from 18 to 30 years. The selection process included anamnesis, clinical otological inspection, acoustic immittance measures, stapedial acoustic reflex, conventional pure tone audiometry (ATL-Cv, 0.25-8kHz) and speech audiometry in order to select a population within audiological normal ranges.
The criteria that defined the standard of acoustic immittance, measures for stapedial acoustic reflex, ATL-Cv and speech discrimination test were defined by Jerger21, Lacerda22 and ANSI S3.623, respectively.
The equipment used for the test was an audiometer SD50 brand SIEMENS, using earphones HDA200, brand SENNHEISER, with Auditory Level correction according to Certificate 1.51-9493/92 and 14738/93 and standards of ANSI S3.623, IEC 645 Safety Norms and bone oscillator B71, ANSI 3.1324 and ISO 38925. We tested frequencies of 9, 10, 11.2, 12.5, 14 and 16kHz, being that the latter was the upper limit of the equipment in kHz.
To test pure tone auditory thresholds we used the descending technique with 10dB intervals up to the moment the subject stopped responding. As of this intensity, the ascending technique was used with 5dB intervals, up to the moment the subject resumed responding. Auditory thresholds was defined in 50% of the responses obtained at the intensity.
Two examiners (A and B) were responsible for the conduction of the tests in order to analyze the intra-subject variability on the same day. Both results were compared.
Earphones were positioned by the examiners (first examiner A) after brief orientation about the task to be performed during the test. At the end of the threshold search for the studied frequencies, the subject removed the earphones and repositioned them and a new threshold search was made for frequencies 9 to 16kHz. This step was included to check variability of results, as reported in the literature, owing to modifications in the position of the sound source towards the ear (acoustic variability). The results obtained in frequencies of 9k and 16kHz, with positioning of the earphones by the examiner, were compared to the new results, obtained for the same frequencies (9 to 16kHz) after repositioning of the earphones by the tested subject.
On a different day, a new assessment was conducted with examiner B starting the assessment and following the same protocol as on the first day, in order to analyze intra-subject variability on different tested days. We decided to include this step because factors related to learning and subjects' fatigue could interfere in the final results.
We required two days to conclude the tests for each subject. The results collected by the same examiner (A or B) on different test days were also compared.
Thus, four high frequency audiograms were obtained for each subject, being that we had four thresholds for frequencies of 10 to 14kHz and 8 thresholds for frequencies of 9 to 16kHz.
The order of presentation of frequencies, the choice of the tested ear and the choice of tested frequencies (9 to 16kHz) were made randomly for each subject, so that the factors concerning learning and test fatigue would not interfere in the study. On the second test day, the tests were conducted on the same acoustic room, approximately at the same hour of the day and following the same sequence of frequencies as the day before.
AT-Cv and speech discrimination were conducted after high frequencies threshold search, preventing fatigue and lack of attention during the AT-AF test on the first day.
Therefore, we tried to control all variables concerning the daily routine of subjects, such as stress, environmental and leisure noise exposure, attention span, time of the day, duration of test, temperature of the environment - characteristics for the day, and other variables that could have interfered in result stability. Chart 1 shows the protocol of assessment that all subjects followed.
Variance analysis (ANOVA) was the statistic test we used to compare the results between the genders, right and left ears and tests conducted on the same day and on different days. T Student's test was used to compare the results obtained in the test and retest of frequencies 9 to 16kHz.
Chart 1. Sequence of assessment protocol.
RESULTS AND DISCUSSION
Statistical analysis of data enabled the definition of the audiometric profile of the studied population as well as the analysis of the variables listed here.
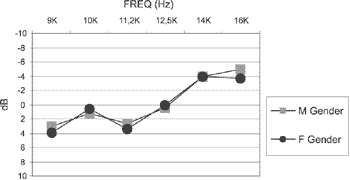
The statistical test employed (ANOVA, with f = 0.05 and p = 0.82) did not detect significant differences between female and male genders (Graph 1). Such results are in accordance with those reported by Hallmo et al.13 and Mattews et al.16.
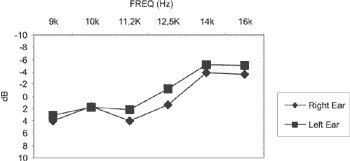
As to interaural variability, the left ear (LE) presented greater sensitivity than the right ear (RE) in most frequencies, such as shown in Graph 2. However, the ANOVA statistical test (f = 3.34 and p = 0.07) did not show statistically significant differences. The absence of statistically significant differences was also detected by Frank and Dreisbach11, Hallmo et al.13, Mattews et al.16.
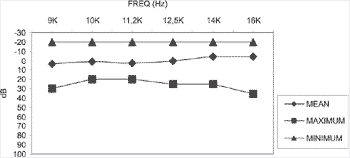
Therefore, we could group the whole population in order to define the audiometric thresholds for the whole frequency range studied (Graph 3 and Table 1). Auditory sensitivity improved as a result of the increase in frequency and the mean threshold was about 3dB in 9kHz, reaching -4dB in 16kHz.
It is important to point out that the present study was benefited by the device SD50, which uses the ANSI S 3.623 and ISO 38925 standards for emissions of high frequency sounds, calibrated in hearing level (dB HL). The other studies reported in the literature analyzed the thresholds in sound pressure level (SPL), according to ANSI S 3.626 standard, and most of them found worsened hearing acuity, suggesting a decrease in auditory sensitivity as a result of increase in frequency.
This characteristic, already found in previous studies, is justified by the fact that the human ear needs more sound energy to be capable of detecting high frequency tones, which demonstrates the physiological behavior of the cochlea to the test tones.
The calibration of the SD50 equipment, once adapted to the assessment of hearing acuity at hearing levels (dB HL), logically shows flat audiometric configuration as a result of the correction made by the test tone intensity, similarly to what happens with audiometers designed for conventional audiometric assessment.
Since these corrections had been made in the equipment used in the present study (dB SPL to dB HL), it was not possible to make comparisons of raw thresholds.
Despite the fact that it was not the purpose of the present study to create a normal range for the audiometry range of high frequencies, we observed that the means did not exceed values of +5 and -5 dB HL in all frequency bands.
Variability that interferes in the results
Feghali and Bernstein3, Stelmachowicz et al.20, Filipo et al.27, pointed out the occurrence of acoustic variability in the high frequency threshold search, as already reported. According to the authors, if present, it can interfere in the inter and intra-subject analysis and does not provide repeatability of results nor good clinical acceptability.
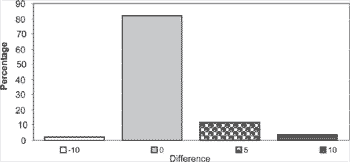
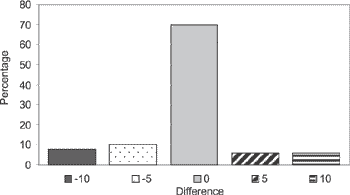
Upon the induction of this variability in threshold definition, the present study did not find statistically significant differences in the results. This analysis, as described in the Material and Method section, was made by test-retest of frequencies 9K and 16kHz, and the results were collected before and after earphone repositioning. In this aspect, the present study is not in accordance with the other authors (Graphs 4 and 5).
The instability in results caused by intra-subject variability is generally associated with its own acoustic variability, as discussed above, or to factors owing to the subject per se. The modification in sound source position, fatigue, attention dedicated to the tests and learning can promote stability of results necessary for the audiometric monitoring to be more efficient in patients with history of exposure to any aggressive agent to the hearing system.
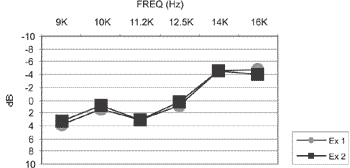
In this study, the analysis of intra-subject variability conducted with the results of two tests of the same subject on the same day was not relevant. The analysis (ANOVA, with f = 1.32 and p = 0.25) did not show statistically significant difference (Graphs 6), which is in accordance with the studies by Feghali and Bernstein3, Frank and Dreisbach11, Hallmo et al.13, Mattews et al.16, Stelmachowicz et al.20.
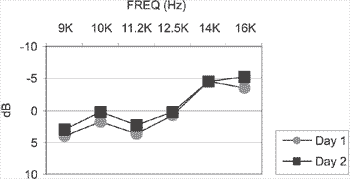
Intra-subject variability related to the change in test results of the same subject, conducted on different days, proved to be important in this study. The data analysis suggested that most probably the effects of the practice with the test could have benefited the results on the second tested day, since the differences were statistically significant and were about +/- 5dB on the day (Graph 7).
The results found by Frank and Dreisbach11, Mattews et al.16 showed differences of up to +/- 10dB between tests. The findings of these authors associated with those by Hallmo et al.13, are not in accordance with those presented by the present study, since the differences were not statistically significant.
In our study, the increase in inter-subject variability occurred as a result of increase in frequency, being clearer above 12kHz. Such difference was also discussed and evidenced in the studies by Feghali and Bernstein3, Schechter et al.6, Fausti et al.9, Hallmo et al.13.
It is worth mentioning that the studies referred here used different methodologies, such as calibration of equipment, earphones, threshold search technique, among others, and even though, the conclusion about the variation in thresholds was similar, showing the predominance of biological variabilities that interfere in the comparison of the results among subjects.
If we cross this information with the intra-subject variability, related to the tests conducted in different days, and with thresholds means, which were best on the second day, we can conclude that the previous practice of high frequency assessment is very useful, taking into consideration that the tested subject had an opportunity to get familiar with the test before starting it effectively. If the practice could have been made in high frequencies, especially above 12kHz (in which inter-subject variability and interaural differences are more marked), maybe the final result would reveal more precisely the reality of the auditory thresholds, since the test would be conducted with more consistency, attention and safety to the subject.
Graph 1. Threshold mean (dBHL) in male and female subjects in the whole frequency range.
Graph 2. Mean thresholds (dBHL) for RE and LE in the whole frequency range.
Graph 3. Means, minimum and maximum (dB HL) for the whole group and frequency range.
Graph 4. Distribution of differences (dB HL) between test and retest in the frequency of 9khz.
Graph 5 - Distribution of differences (dBHL) between test and retest of frequency of 16khz.
Graph 6 - Mean of thresholds (dBHL) in the tests conducted on the same day for the whole frequency range.
Graph 7 - Mean of thresholds (dBHL) in tests conducted on different days in the whole frequency range.
Table 1. Values of mean, minimum and maximum (dBHL) for the whole population in all frequencies analyzed.
CONCLUSION
According to the analysis of the results of the statistical tests used in the present study, we concluded that there were no statistically significant differences between hearing sensitivity in men and women for high frequency sounds, neither for right nor left ears. It can suggest a pattern of similar responses for the whole population that presents homogenous characteristics concerning audiological profile and age range.
Result instability between tests of the same subject, leading to imprecise audiological monitoring, can exist if the subject is not properly trained in the test. Variations are probably caused by test practice, since the statistical analysis did not show the importance of any other variability studied in the present research.
The referred practice is nothing more than the subjects getting familiar with the test tones. The analysis of the SD and interaural difference suggests that this practice should be preferably made with high frequencies of the audiometry range, that is, above 12kHz, as a result of the greater variability of results in this region of frequency.
Biological variabilities will always exist, interfering in the results of tests, regardless of the methodology employed. They are intrinsic to the subject and difficult to control when the methodology is directed to the clinical routine. In audiological monitoring of high frequencies, the tests could be compared individually but not among subjects.
Even though it was not the purpose of the present study to create a normal pattern for the audiometry field of high frequencies in normal subjects, and regardless of the fact that there is inter-subject variation, we could observe the linearity of auditory results observed by means of the analyzed frequency, remaining between + 5 and -5dB HL.
ACKNOWLEDGMENT
To Pontifical Catholic University of São Paulo, to Hospital de Reabilitação de Anomalias Craniofaciais - USP, to Centro de Distúrbios da Audição Linguagem e Visão, to Centro de Pesquisas Audiológicas, to FUNCRAF and CAPES/DS, for helping me make this dream come true.
To the Audiologists Fabiana Velludo Bighetti and Isabela Monteiro de Castro, for helping in the assessment of subjects.
REFERENCES
1. Tonndorf J, Kurman B. High frequency audiometry. Ann Otol Rhinol Laryngol 1984;93: 576-582.
2. Stelmachowicz PG, Beauchaine KA, Kalberer A, Langer T, Jesteadt W. The reliability of auditory thresholds in the 8- to 20-kHz range using a prototype audiometer. J Acoust Soc Am 1988;83:1528-1535.
3. Feghali JG, Bernstein RS. A new approach to serial monitoring of ultra-high frequency hearing. Laryngoscope 1991;101:825-829.
4. Zislis T. Relation of high frequency thresholds to age and sex. J Aud Res 1966;6:189-198.
5. Schneider B, Trehub SE, Bull D. High-frequency sensitivity in infants. Science 1980;207:1003-1004.
6. Schechter MA, Fausti SA, Rappaport BZ, Frey RH. Age categorization of high-frequency auditory threshold data. J Acoust Soc Am 1986;79: 767-771.
7. Trehub SE, Schneider BA, Morrongiello BA, Thorpe LA. Developmental changes in high-frequency sensitivity. Audiology 1989;28:241-249.
8. Osterhammel D. High-frequency thresholds using a quasi-free-field technique. Scand Audiol 1978;7:27-30.
9. Fausti SA, Frey RH, Erickson DA, Rappaport BZ, Cleary EJ, Brummett RE. A system for evaluating auditory function from 8000-20000Hz. J Acoust Soc Am 1979;66:1713-1718.
10. Green DM, Kidd Jr. G, Stevens KN. High-frequency audiometric assesment of a young adult population. J Acoust Soc Am 1987;81:485-494.
11. Frank T, Dreisbach LE. Repeatibility of high-frequency thresholds. Ear Hear 1991;12:294-295.
12. Löppönen H, Sorri M. High-frequency air-conduction and eletric bone-conduction audiometry. Comparison of two methods. Scand Audiol 1991;20:175-180.
13. Hallmo P, Borchgrevink HM, Mair IWS. Extended high-frequency thresholds in noise-induced hearing loss. Scand Audiol 1995;24:47-52.
14. Fouquet ML. Limiares de audibilidade nas freqüências ultra-altas de 9 a 18kHz em adultos de 18 a 30 anos [Especialização]. São Paulo: Universidade Federal de São Paulo, Escola Paulista de Medicina; 1997.
15. Azevedo LL. Estudo dos limiares de audibilidade nas altas freqüências em indivíduos de 12 a 15 anos com audição normal [Especialização] São Paulo: Universidade Federal de São Paulo, Escola Paulista de Medicina; 1997.
16. Mattews LJ, Lee FS, Mills JH, Dubno JR. Extended high-frequency thresholds in older adults. J Speech Hear Res 1997;40:208-214.
17. Fletcher JL. Reliability of high-frequency thresholds. J Aud Res 1965;5:133-137.
18. Northern JL, Downs MP, Rudmose W, Glorig A, Fletcher JL. Recomended high-frequency audiometry threshold level (8000-18000Hz). J Acoust Soc Am 1971:52:585-595.
19. Stevens KN, Berkovitz R, Kidd G, Green DM. Calibration of ear canals for audiometry at high frequencies. J Acoust Soc Am 1987;81:470-484.
20. Stelmachowicz PG, Beauchaine KA, Kalberer A, Jesteadt W. Normative thresholds in the 8- to 20-kHz range as function of age. J Acoust Soc Am 1989;86:1384-1391.
21. Stelmachowicz PG, Beauchaine KA, Kalberer A, Kelly WJ, Jesteadt W. High-frequency audiometry: test reliability and procedural considerations. J Acoust Soc Am 1989;85:879-887.
22. Jerger S, Jerger J. Alterações auditivas. Um manual para avaliação clínica. Rio de Janeiro: Livraria Atheneu; 1989.
23. Lacerda AP. Audilogia clínica. Rio de Janeiro: Guanabara Koogan; 1976.
24. American National Standard Institute. American National Stadard Specification for Audiometers (ANSI S3.6). New York: ANSI; 1989.
25. American National Standard Institute. American National Stadard Specification for Audiometers (ANSI 3.13). New York: ANSI; 1972.
26. International Organization for Standardization. ISO 389 ADDA. Acoustics. Standard Reference zero for the calibration of pure-tone audiometers. Geneva: International Organization for Standardization; 1983.
27. American National Standard Institute. American National Stadard Specification for Audiometers (ANSI 3.6). New York: ANSI; 1969.
28. Filipo R, De Seta E, Bertoli BA. High-frequency audiometry in juvenile diabetes. Adv Audiol 1985;3:106-111.
1 Audiologist, Centro de Atendimentos de Distúrbios da Audição, Linguagem e Visão, Hospital de Reabilitação de Anomalias Craniofaciais, University of São Paulo (CEDALVI - HRAC - USP), Master in Communication Disorders, Pontifical Catholic University of São Paulo.
2 Physician, Hospital de Reabilitação de Anomalias Craniofaciais, University of São Paulo (HRAC-USP), Department of Speech and Voice Therapy and Audiology, School of Dental Medicine of Bauru (FOB-USP), responsible for Centro de Pesquisas Audiológicas, Hospital de Reabilitação de Anomalias Craniofaciais (CPA-HRAC-USP).
3 Ph.D., Professor of the Course of Speech and Voice Therapy and Audiology, School of Dental Medicine of Bauru, University of São Paulo (FOB-USP).
Affiliation: Pontifical Catholic University of São Paulo. Master Dissertation presented as a conference at 15º Encontro Internacional de Audiologia, in the city of Bauru, on April 14-17, 2000.
Address Correspondence to:
Daniela Rodrigues Shayeb - R. Júlio de Mesquita Filho 6-27. Vila Universitária. Bauru - S. P.
CEP: 17011-450. Tel: (55 14) 234-1335/234-3563 e 234-7884, ramal 220. E-mail: nancishayeb@uol.com.br
Financial support: Capes. Study approved by the Research Ethics Committee, HRAC-USP, under Protocol N.93/2002-UEP-PC.
Article submitted on November 08, 2002. Article accepted on February 07, 2003.

