

Year: 2001 Vol. 67 Ed. 3 - (3º)
Artigos Originais
Pages: 307 to 316
Analysis of the Amplitude DPOAE in Frequencies 1, 2 and 4 kHz, in Normal Hearing Subjects, Varing the Intensities of the Primary Levels Stimulus.
Author(s):
Lúcia K. Nishino*,
Marcia P. Ravagnani*,
Mariana J. Azambuja*,
Otacílio Lopes Filho**,
Rosimeire Carlos***.
Keywords: otoacoustic emission, standartization.
Abstract:
Introduction: Otoacoustic emissions (OAE) are being more used in clinical routine as a complement test for be rapid, objective, noninvasive and easy application for screening hearing. In special, distortion-product otoacoustic emissions (DPOAE) are important tool for investigate any frequency depending on the choice of primary stimulus, that allow broader clinical application than other types OAE. In despite of this, the amplitude DPOAE has showed considerable variability of the person to person. Aim: The purpose of this study were compare the amplitudes DPOAE, obtained with the differents primary-levels stimulus in normal hearing subjects, varying geometric means values 1, 2 and 4 kHz. Study design: Prospective clinical. Material and method: For this, 95 subjects, means age 22.8 years, without any history of otologic or hereditary diseases. AH subjects had normal otoscopic findings, audiometric pune-tone thresholds of 20 dB hearing level or less at octave frequencies between 0.25 and 8 kHz, normal middle-ear pressure and normal acoustic reflex thresholds and so, the ear that showed better hearing thresholds and absence of spontaneous otoacoust emissions in range of 50 Hz of frequency DPOAE was begun the recording of DPOAE with Madsen Eletronics Cochlear Emissions Analyzer (Celesta 503 - 3.xx). The ratio of the frequency of the two tones (f2/fl) was kept constant and equal to 1,22 and the two stimulus were showed in these intensities of the fl and f2, respectively: 70-70 dB NPS, 70-60 dB NPS, 65-65 dB NPS, 65-55 dB NPS, 60-60 dB NPS and 60-50 dB NPS. Conclusion: We conclueded that set L1>L2 produce bigger amplitudes DPOAE than L1=L2 and besides, as more bigger the intensities used, more bigger the responses as L1=L2 as L1>L2.
![]()
INTRODUCTION
Measures of otoacoustic emissions (OAE) have become increasingly popular in the audiological routine as a complementary method because they are quick, objective, non-invasive and easy to apply in the investigation of auditory disorders. Its growing contribution has supported more precise diagnosis and treatment. In addition, it is of great help when treating difficult cases, such as neonates and non-cooperative children and adults.
Among the types of OAE, the distortion product (DPOAEs) has taken center stage because it enables assessment of any frequency from a pre-selection of primary stimuli, providing more comprehensive clinical application than the other types of otoacoustic emissions. This special characteristic of DPOAEs has generated a large quantity of investigations, in order to define the most sensitive test for different types of hearing losses.
One positive aspect is that although DPOAEs is an objective test, amplitude of DPOAEs has shown great individual variability, probably because each investigator uses a different parameter of stimuli, such as primary stimuli intensity, difference or not between them and primary frequencies, in addition to individual characteristics of each ear, possible influences from the central nervous system and presence of other types of otoacoustic emissions.
Within this perspective, the present study aimed at comparing amplitude of DPOAEs obtained with different levels of stimuli in normal hearing subjects and in the frequencies 1, 2 and 4KkHz. Therefore, we tried to identify what intensity of stimulus would be better to have a more sensitive exam, so that we could have better responses.
We hope that the present study will help the understanding about the factors that influence the great variability observed in responses; thus, by controlling better the variables, we will improve the method and efficiently employ all capabilities of the test.
Otoacoustic emissions
In 1948, Gold proposed that the inner ear was an organ directed not only to sound capturing, but also to the generation of acoustic energy. This peculiarity of the ear to produce sounds, the so-called otoacoustic emissions, was confirmed by David Kemp in 1978. He was the first one to confirm that otoacoustic emissions may be spontaneously produced by the inner ear or as a response to some stimulation. Since then, various researchers have investigated this capability of the cochlea of transmitting back to the external ear canal (EAC).
Norton and Stover21 (1994) defined otoacoustic emissions as the sound generated spontaneously by the normal cochlea or as a response to acoustic stimulation.
These low intensity acoustic signals are produced by the cochlea, more specifically by the outer hair cells (OHC), which have the basic characteristics of expanding and contracting. According to Coube (1997)4 movement of OHC, both spontaneous and as a response to acoustic stimuli, produces mechanical energy inside the cochlea and this energy is transmitted through the middle ear and the tympanic membrane. In order to record the sounds, we place a miniaturized microphone close to the sealing tip, which is introduced into the EAC. Since they are very low amplitude sounds, they should be amplified thousands of times (about 10 thousand times) so that they may be measured by the device (Lopes Filho et al., 199615).
The concept of active cochlea enabled more comprehension about the functioning of Corti's organ structures, especially OHC, showing the existence of an active process inside the cochlea. The latest breakthrough in the area of cochlear biomechanics suggested that OHC do not have a direct role in sound transduction, but rather an important role as amplifier, increasing the mechanical sound to the inner hear cells (IHC) (Alberti, P. W R. M.1, 1994). When stimulated by sound, the OHC contract, increasing the movement of basilar membrane and amplifying the stimuli provided to the IHC, which in turn, as a result of its rich afferent nervous supply, through the VIII nerve, start the transformation of sound that reaches the cochlea as electrical energy to be sent to the cortex.
Therefore, the OHC are considered active working cells, because by means of their contracting properties they increase the amplitude of vibration of the basilar membrane, consequently leading to increased stimulation of the IHC, which are responsible for hearing thresholds. Thus, input sound sensitivity would be increased (Bray3, 1989; Lopes Filho et al.15, 1996). According to Oliveira22 (1994), this cochlear mechanism enables an increase of up to 50dB SPL in the intensity of the stimulus.
Measurement of otoacoustic emissions has been recognized as a very useful test to detect auditory disorders, especially cochlear ones. Tanaka et al.26 (1987) studied the recording of transient otoacoustic emissions (TOAEs) as an indicator of the evolution of inner ear problems and concluded that recording of TOAEs is clinically applicable in the differential diagnosis of sensorineural hearing loss and for the follow-up of inner ear problems, to check progression of hearing loss and to monitor cases of use of ototoxic drugs. We may also add the follow-up of patients who have fluctuations of hearing thresholds.
As to DPOAEs, Coube4 (1997) reported that since it is possible to measure the activity of high frequencies (between 4 and 8kHz), the test had good sensitivity for initial stages of cochlear dysfunction in cases of sensorineural loss that started with outer hair cell lesions, responsible for high frequencies, such as presbyacusis and noise-induced hearing loss.
Kemp et al.17 (1990) reported that in cases of temporary hearing threshold shift caused by exposure to high noises, there is a temporary suspension of vibration response to the stimulus in the cochlea, which happens also in cases of anoxia, ototoxic drugs, endolymphatic hydrops and others. Moreover, since DPOAEs evaluate mainly the activity of OHC, they help differentiate sensorial hearing losses from purely neural losses, supporting the differential diagnosis of cochlear and retrocochlear losses.
According to Lonsbury-Martin10 (1994), thanks to its objectivity, the DPOAEs test is ideal to test patients that may not be safely evaluated with other routine procedures. Some examples are very young patients, neonates, foreigners, elderly patients with mental confusion and malingerers.
It is important to point out, though, that otoacoustic emissions do not provide data about thresholds, because the assessment is limited to the cochlear biomechanics. Therefore, the test should not be used to replace pure tone audiometry, but as another tool for the audiological battery of tests.
Up to present, there were two main types of OAEs studied, based on absence or presence of external acoustic stimulation: spontaneous otoacoustic emissions and evoked otoacoustic emissions, respectively.
Spontaneous otoacoustic emissions (SOAEs) are narrow band acoustic signs that may be detected in approximately one third of the ears audiologically normal without external stimulation (Gobsch and Tietze6, 1993). According to Norton and Stover21 (1994), they are normally not detected in frequencies that have sensorineural loss above 30dB HL.
Evoked otoacoustic emissions may be separated in three subclasses, according to the type of acoustic signal used to trigger them: transient evoked otoacoustic emissions (TOAEs) and distortion product otoacoustic emissions (DPOAEs).
TOAEs are responses obtained from the stimulation of the cochlea by the use of a very short acoustic stimulus - normally, a click. Since it is a wide band noise, there is excitation of hair cells located from the basal spiral up to the apical spiral of the cochlea, and the response also comprises different frequencies.
As reported by Kok et at.11 (1992), most of the studies about TOAEs mention that its prevalence in normal hearing subjects is of 90-100% and this value reduces as a result of hearing loss. Kemp (apud Norton and Stover2l, 1994) stated that TOAEs are not detectable in ears with sensorineural hearing losses that exceed 30dB HL.
Frequency-dependent otoacoustic emissions reflect the cochlear response for the input of continuous and low level pure tones and they are simultaneous to the triggering stimulus and in the same frequency. Its prevalence is lower than TOAEs (about 93%) and they may be found in subjects with hearing thresholds better than 20dBHL (Lopes Filho and Carlos in Lopes Filho et al.13, 1997).
Distortion product otoacoustic emissions occur when the stimulation is made by the simultaneous presentation of two pure tones of different frequencies (f1 and f2). The response is characterized by the occurrence of sound whose frequencies are distortion products of a combination of the stimulated frequencies (normally 2f1 - f2, being f1/f2 approximately 1.2). According to Lopes Filho and Carlos13 (1996), DPOAEs are recorded at normal thresholds and in hearing losses up to 50dBHL. In addition, its prevalence in normal hearing subjects is about 100% (Lonsbury-Martin et al.12, 1991).
As reported by Coube4 (1997), since SOAEs are not present in all audiologically normal ears, in addition to the difficulties found to collect and analyze them, TOAEs and DPOAEs have been more frequently used up to the moment. According to the author, the measure of DPOAEs has the advantage of enabling intentional testing of any frequency between approximately 1 and 8KHz. It is the specificity by frequency that expands the clinical applicability for the diagnosis of auditory disorders.
Detailed characteristics of otoacoustic emissions for each subject provide a rich source of information about the ear through which it emerged, contributing as specifc diagnostic markers (Kemp et al.17, 1990). In spite of this fact, it is important to highlight that before otoacoustic emissions are recorded in the EAC, vibration energy should be conducted inversely from the cochlea through the ossicle chain, and then through the tympanic membrane and the EAC, in which it is recorded (Coube4,1997). Therefore, any alteration of tympanic-ossicle system may be enough to reduce the amplitude or even cancel the otoacoustic emissions. This fact requires the conduction of tympanometry and acoustic reflex investigation as prerequirements for the measurements of OAEs, guaranteeing that the middle ear is absolutely normal. Unless the tests are performed, we may come to inaccurate conclusions about the results. As pointed out by Lopes Filho et al.15 (1996), the presence of OAEs is extremely significant, but its absence may be significant if there is normal tympanometry and present acoustic reflexes. The same thought is shared by Smurzynski24 (1994), who stated that the transmission of sound information from the EAC to the cochlea or the other way around, depends on different conditions, such as capacity to seal the EAC accordingly, the meatus itself, middle ear conditions and even alterations that may result from the development of external, middle and inner ears.
Distortion Product Otoacoustic Emissions
Distortion products are phenomena common to different physical systems. They are generated by nonlinear elements that distort the signal, thus creating additional frequencies (Probst and Hauser23, 1990).
The existence of distortion product, and therefore, of non-linear elements in the hearing system at middle levels of stimulation was demonstrated a long time ago. Kemp16 (1979) defined DPOAEs as distorted intermodulation responses produced by the ear in response to two simultaneous pure tones referred as primary tones.
When two pure tones of different frequencies pass through a non-linear amplifier, such as the cochlea, the output signal contains other frequencies that were not part of the original pure tones. These tones which were not in the original signal are the distorted products and through them it is possible to evaluate cochlear activity in specific frequencies (Lopes Filho et al.15, 1996).
Emissions seem to represent an escape of energy resulting from the inability of the basilar membrane to respond to two simultaneous stimuli. Such property is continuously extended to the whole basilar membrane and DPOAEs may be generated in any frequency through selected stimuli (Lopes Filho et al.15, 1996).
As previously reported, DPOAEs are detected acoustic energies at the auditory canal originated from the interaction of two pure tones of different frequencies (fl and f2), called primary tones (Bonfils and Avan2, 1992). By default, the pure tone of the lowest frequency is called primary fl and its intensity L1, whereas the highest frequency pure tone is called f2 and its intensity is L2.
The frequency response 2f1-f2, in which f1
Distortion products may be analyzed through the input/output graph and DP gram. In the first case, the frequency is fixed, but stimulus intensities vary. Therefore, we obtain the thresholds of otoacoustic emissions. Through the use of DP gram, we evaluate the responses obtained in different frequencies, but at fixed intensities L1 and L2. Only the second type will be emphasized because it was the method used in the present study.
Recent theories relate the origin of otoacoustic emissions to the active cochlear mechanism. It is a result of the action of OHC that transform the cochlea into an amplifier, enabling an increase of up to 50dB SPL at the intensity of a stimulus. Owing to its contraction capacity, OHC cause an increase in amplitude of vibration of the basilar membrane, leading to more stimulation of IHC, whose steriocilia were not in contact with the tectorial membrane (Oliveira, J. A. in Lopes Filho and Carlos14, 1996).
It is important to point out that the process also has an efferent control, taken care by the olivocochlear tract. It causes alteration of basilar membrane tension, which in turn, also influences the contraction of OHC.
In their studies, Gaskill and Browns (1990) noticed that an increased response reflected the adjustment in the cochlear amplifier to the stimuli level, amplifying relatively lower levels compared to higher ones. The level of saturation shows the upper limit of the amplification mechanism. According to the same authors, histologic experiments revealed that damage to OHC corresponded to reduced levels of response, confirming the involvement of OHC in the generation of distortion product. They are essential for frequency sensitivity and selectivity; similarly, frequency properties of basilar membrane depend on the health of OHC.
Although measures of DPOAEs are methods that have a lot to contribute to the diagnosis of auditory disorders, there are still a number of aspects concerning the conduction of the exam that should be clarified. Among them, we may point out the characteristics of the stimulus employed, such as the ratio between primary frequencies, intensities of primary stimulus and the criteria used to consider DPOAEs present.
There are controversies as to the ideal intensity to be employed in f1 and f2. Hauser and Probst9 (1991) suggested that if we fixated L2 lower than L1 it would result in improvement of signal-noise ratio and increase detectability of small amplitude responses in human ears. The authors also argued that the L2-L1 difference to evoke the highest amplitude of DPOAEs depended on the stimulus frequency, ranging from -10 to OdB. In the study, the level of L2 varied and Ll was maintained constant at 65 or 75 dBSPL, and maximum amplitudes were produced with differences lower than L2-L1 in 4kHz than in 1 or 2 kHz. Also Wiederhold et al. (apud Hauser and Probst9 (1991) in their findings with animals, showed that primary levels are more effective when L1 is 5-l0dB higher than L2. The same values were found by Schloth (1982) apud Hauser and Probst9 (1991), in their studies with human beings.
Kimberley et al.18 (1994) maintained constant a l0dB difference between the intensities of f1 and f2, starting from f1=30dBSPL and f2=20dBSPL, increasing by 5 dB steps up to f1=60 dB SPL and f2=50 dB SPL. Similarly, Gaskill and Brown5 (1990) used levels of 40-45dNSPL for f2, with fixed L1 15dB higher than L2. The authors also concluded that maximum distortion was obtained when L1 was higher than L2.
It is important to highlight that although many authors refer that maximum amplitude of DPOAEs may be detected using a L1-L2 difference, the standardization of the device Celesta 503 (version 3.anc), widely used in the clinical practice, was conducted with intensities that varied from 40 to 75 dBSPL, with 5dB increase steps and maintaining L1 = L2. The standardization was carried out based on the study conducted by Osterhammel, who evaluated 20 audiologically normal subjects aged 34 years in average in Denmark.
Recent studies revealed that frequencies of 500, 750 and 8,000Hz did not present good reproducibility (Lopes Filho et al.15, 1996). It was observed in the study by Probst and Hauser23 (1990), in which most normal or close to normal ears had absent or very low amplitude in frequencies 500 to 8,000Hz. It may be explained by the fact that not all devices provide testing after 6,000Hz, and as to low frequencies, background noise interferes in the recording of responses.
As to the ratio fixed for primary frequencies, Smurzynski et al .25 (1990) suggested 1.2 so that more energy could be obtained from the responses. The same value was found by Kimberley et al.15 (1994) and Nelson and Kimberley20 (1992). Harris7 (1990) used the ratio 1.21 for tested frequencies, except 750 Hz, in which he used 1.19. In the studies by Harris et al. apud Gaskill and Browcis (1990), the best ratio foundwas 1.22, whereas in the studies by Gaskill and Brown5 (1990) the value 1.225 provided recordable responses of distortion product for most of the frequencies and the subjects. In all cases evaluated by Bonfils and Avan2 (1992), the ratio 1.23 was the most sensitive both for analysis of amplitude of response and input-output function.
Another aspect that has been listed as an influent agent in variability of amplitude of DPOAEs is the presence of SOAEs in frequencies close to the analyzed ones (Probst and Hauser23, 1990).
According to Nelson and Kimberley20 (1992), it has already been found by several studies that SOAEs near the frequencies of DPOAEs may increase the levels of the latter. This fact made Harris7 (1990) exclude from his study subjects who had the presence of SOAEs in the tested ear.
In the study by Hauser and Probst9 (1991), about the effects of variation of primary levels of L2-L1 on the amplitude of DPOAEs, only subjects without SOAEs within 100Hz from the frequency of DPOAEs were accepted. According to the authors, SOAEs may strongly influence the measures of DPOAEs.
Kimberley et al.18 (1994) also reported that the presence of SOAEs may artificially increase amplitude of response; the same is true for middle ear conditions (frequency of resonance, for example), which may affect the recording of responses. Gaskill and Browns (1990), however, believe that DP gram may be influenced by strong stimulus-frequency emissions, but it does not substantially modify the response but rather masks the matching with auditory sensitivity.
SOAEs have been more frequently found in women than in men. However, it is not known if this is the reason why there are minor differences of response concerning the different genders. In the study by Hauser and Probst9 (1991), even though there were no significant differences in maximum amplitude of DPOAEs among male and female subjects, the latter presented mean amplitude higher than men in all measures. In the study by Gaskill and Browns (1990), the mean distortion levels in female ears were higher than male ears in 5 out of 8 analyzed frequencies, but upon the analyzes of the whole frequency range, the difference was significant only in 13%.
As to age, Lonsbury-Martin et al.11 (1991) showed a systematic decrease of amplitude of response. According to subjects' age, it is increased from 31 to 60 years.
Finally, regarding signal to noise ratio, most of the authors consider present DPOAEs if they are at least 3 dBSPL above the background noise. In the study by Hauser and Prbbst9 (1991), DPOAEs were accepted as response if they were at least 4dBSPL above the background noise. Harris7 (1990) considered responses the amplitudes of 2f1-f2 that were at least 3dBSPL above the background noise in two consecutive presentations. The same was followed by Kimberley et al.18 (1994). Alternatively, Probst and Hauser23 (1990), considered a minimum level of 6dBSPL above the background noise to accept a response of DPOAEs. Harris and Probst (1991) considered as DPOAEs thresholds the first point of the response curve in which amplitude of 2f1-f2 was > 5dBSPL compared to the background noise.
Therefore, the present study aimed at comparing amplitude of DPOAEs obtained with different levels of primary stimuli in normal hearing subjects in frequencies 1, 2 and 4kHz.
MATERIAL AND METHOD
The sample consisted of 95 subjects aged 16 to 31 years (mean age of 22.8 years), 66 female and 29 male subjects, with no previous history of otologic affections or family history of auditory problems.
They were all submitted to anamnesis, inspection of the external auditory canal, pure tone audiometry, speech discrimination and acoustic immitance tests. The results met the following criteria bilaterally:
pure tone thresholds equal or below 20dBHL at the frequency range 250-8kHz;
percentage equal or better than 96% in speech recognition index;
maximum complacency of tympanic membrane at 0daPa, and
contralateral stapedial reflexes present at the frequencies of 500 Hz, 1 kHz, 2 kHz and 4 kHz.
To evaluate DPOAEs, we chose the ear that had the best auditory thresholds and absence of SOAEs within a range of 50Hz from the frequency of DPOAEs.
The measure of OAEs was performed with the cochlear analyzer Celesta 503 (version 3.xx) coupled to a PC 486 with DOS 6.22 via connection RS232C, using the software NOAH, version 2.0, within Windows 95.
To obtain the distortion product, the sound stimuli were presented in two channels, in the frequencies (f1and f2) whose geometrical average was 1, 2 and 4kHz, maintaining the fix ratio of 1.22 between primary frequencies. The stimuli were presented at the following intensities of fl and f2, respectively: 70-70 dB SPL, 70-60 dB SPL, 65-65 dB SPL, 65-55 dB SPL, 60-60 dB SPL and 6050 dB SPL. DPOAEs were accepted when they were at least 3dBSPL above the background noise. The measure of SOAEs was conducted right after, without removing the probe up to completing both procedures. In the first 20 ears, the tests were conducted twice consecutively in order to ensure reliability of data. Since no statistically significant differences were noted among the results, the remaining subjects were tested only once.
During the assessment, the subjects were comfortably seated and were asked to be as quiet as possible. The complete individual assessment took approximately 45 minutes to be performed.
Statistical analysis of data were conducted through the analysis of variance (test F), with significance level of 5% (a=5%).
RESULTS
Table 1 presents the mean, standard deviation and amplitude variation of DPOAEs in dBSPL for each of the six studied pairs of intensity, in frequencies 1, 2 and 4 kHz.
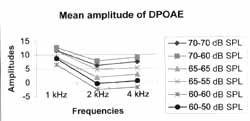
Comparing the pairs of intensity in which there were no statistically significant differences between L1 and L2 (70-70 dB SPL, 65-65 dB SPL and 60-60 dB SPL), we observed that, combination 70-70 dB SPL triggered responses with amplitude significantly higher in all studied frequencies, followed by 65-65 dB SPL. The pair 60-60 dB SPL triggered the lowest responses observed.
As to intensity pairs with l0dB difference between L1 and L2 (70-60 dB SPL, 65-55 dB SPL and 60-50 dB SPL), we noticed the following aspects:
At 1 kHz, the responses obtained for stimuli 70-60 dB SPL and 65-55 dB SPL did not produce statistically significant difference. In spite of that, the mean amplitude was higher for the stimulus 70-60 dB SPL. Between the pairs 70-60 dB SPL/ 60-50 dB SPL, the former triggered significantly higher responses; the same was true for 65-55 dB SPL/60-50 dB SPL.
At 2 and 4 kHz, the pair 70-60 dB SPL originated the highest responses, followed by 65-55 dB SPL.
For all frequencies, the combination 60-50dB SPL generated responses with the lowest amplitudes.
The data described above may be seen in Figure 1.
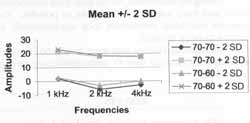
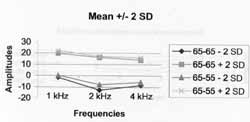
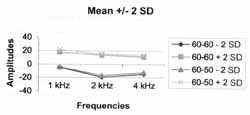
By analyzing the pairs of intensity in which L1 was fixed and L2 was l0dB equal or below L1 (70-70 dB SPL/ 70-60 dB SPL; 65-65 dB SPL/65-55 dB SPL and 60-60 dB SPL/60-50 dB SPL), we observed that (Figures 2, 3 and 4):
The frequency of 1 kHz, ratio L1>L2, being L1=65 or 60 dB SPL, produced significantly higher responses than the ratio L1=L2. When L1=70 dB SPL, the difference between the ratios was not significant; however, the mean amplitude was higher than L1>L2.
The frequency of 2 kHz, ratio L1>L2, with L1=70 or 65 dB SPL, triggered significantly higher responses than the ratio L1=L2. When L1=60 dB SPL there was no significant difference between the used ratios. Despite that, the stimulus of 60-50 dBSPL in average triggered responses with higher amplitudes.
For the frequency of 4kHz for the three intensities of L1, the amplitude of responses was significantly higher when L1 > L2.
We noticed that regardless of the used stimuli, the response curve maintained the same profile, and 1kHz had the highest amplitudes, followed by 4 and 2kHz, respectively.
By analyzing the amplitudes of DPOAEs and gender, the following was noticed:
At 1kHz, there was no statistically significant difference among the six pairs of analyzed intensities. However, for all of them, the mean amplitude was higher in female ears.
At 2kHz, the mean emissions in women were significantly higher for the stimuli 70-70 dB SPL, 65-65 dB SPL, 65-55 dB SPL and 60-50 dB SPL. For intensities 70-60 dB SPL and 60-60 dB SPL, the difference was not statistically significant. However, in both cases, the mean response was higher in female than in male ears.
At 4kHz, the response in women was significantly higher for all used stimuli, except for the pair 6050 dBSPL, in which, despite the mean female amplitudes higher than male ones, there was no statistically significant difference.
TABLE 1 - Variation of amplitude, mean, standard deviation of DPOAEs in dB SPL in different stimuli frequencies studied in 95 normal hearing subjects (Santa Casa de Misericórdia de São Paulo, 1999).
NB. Find in bold the highest amplitude values.
There were no statistically significant differences in responses of right and left ears for any of the stimuli. It happened for all studied frequencies, except for 1kHz, with the stimulus of 70-70dB SPL, in which the mean of DPOAEs was higher on the right ear. It is important to point out that although the difference was not significant, most of the amplitudes for all stimuli were higher on the right ear.
Figure 1. Mean amplitude of DPOAEs (in dB SPL), in frequencies 1, 2 and 4 kHz, for the six analyzed pairs of intensity.
Figure 2. Means +/- Standard Deviation of amplitudes of DPOAEs (in dB SPL), for frequencies 1, 2 and 4 kHz, intensities 70-70 dB SPL and 70-60 dB SPL.
DISCUSSION
The present study compared amplitudes of DPOAEs in normal hearing subjects, collected at different levels of stimuli, in frequencies of 1, 2 and 4kHz, in which we observed a wide variability of amplitudes in all used stimuli. This fact had also been observed by Gaskill and Brown5 (1990) and Hauser and Probst9 (1991), and the latter believed that variability was due to the different parameters of stimuli and individual characteristics of ears, such as middle ear mechanisms, possible influences of central nervous system and other types of emissions.
Figure 3. Means +/- Standard Deviation of DPOAEs amplitudes (in dB SPL), for frequencies 1, 2 and 4 kHz, at intensities 65-65 dB SPL and 65-55 dB SPL.
Figure 4. Means +/- Standard Deviation of DPOAEs amplitudes (in dB SPL), for frequencies 1, 2 and 4 kHz, at intensities 60-60 dB SPL and 60-50 dB SPL.
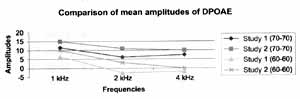
In general, we observed that for the three analyzed frequencies, the higher the amplitude, the higher the intensity of L1, both for stimulus ratio of 0 or l0dB. Osterhammel also observed that amplitudes of DPOAEs increased as a result of the increase of stimuli. In Figure 5, by comparing our results (Study 1) with the findings found by the authors (Study 2), with intensities of 70-70 dB SPL, 65-65 dB SPL and 60-60 dB SPL, in frequencies of 1, 2 and 4kHz, it was possible to notice that there were no statistically significant differences among the responses, except for the frequency of 2kHz at the intensity of 60-60dBSPL.
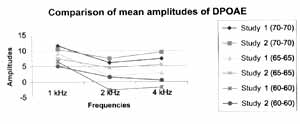
The same fact was observed by Lopes Filho et al., 1995 (apud Lopes Filho et al.15, 1996). By comparing (Figure 6) our results (Study 1) and the findings of the authors (Study 2), with intensities of 70-70 dB SPL and 6060 dB SPL, in frequencies of 1, 2 and 4 kHz, it is possible to note that there were statistically significant differences among the responses, except for the frequency of 4kHz, at the intensity of 60-60dBSPL. With both pairs of stimuli in all analyzed frequencies, the mean amplitude was higher in the study conducted by Lopes Filho et al., 1995 (apud Lopes Filho et al.15, 1996).
Another aspect observed was that for the same intensity of L1, the response was higher if we used a 10dB difference among stimuli of all frequencies. This finding was compatible with the data by Kimberley18 (1994), Gaskill and Brown5 (1990) and Hauser and Probst9 (1991), which advocated that maximum amplitudes of DPOAEs should be investigated with L1>L2.
Based on the collected results, we noticed that the highest means were observed when L1=70 dBSPL in all studied frequencies, and it was even higher if there was a 10dB difference between stimuli. The difference was not statistically significant only for 1kHz.
As to gender, our results are in accordance with the findings by Hauser and Probst9 (1991) and Gaskill and Browns (1990), who observed that mean amplitudes of DPOAEs in female ears were systematically higher than in men, despite the fact that there were no statistically significant differences.
CONCLUSION
We concluded that, similarly to different authors, by maintaining L1 > L2 we may produce amplitudes of DPOAEs higher than for L1=L2. Moreover, the higher the intensity used, the higher the amplitudes triggered, both for L1=L2 and for Ll >L2. However, the maximum intensity used in the study was 70dBSPL, so we could not observe if an increase in intensity would lead to higher responses or if there would be saturation of DPOAEs, since amplitudes have increased up to the current level.
We concluded that the highest responses in normal subjects were obtained with L1 = 70db SPL, especially when we maintained the ratio 70-60dBSPL. However, further studies in hearing impaired subjects are required to investigate the presence of DPOAEs in the studied frequency range and check whether the difference among the levels would also increase amplitude or whether it would decrease as a result of the reduced intensity of L2.
Based on these findings, we should be more careful when selecting the intensity of employed stimuli to study DPOAEs, since this aspect may affect the detectability of responses. In addition, many studies still have to be carried out to further investigate the capabilities of the test.
Figure 5. Comparison of mean amplitudes of DPOAE (in dB SPL), for frequencies 1, 2 and 4 kHz, at intensities 70-70 dB SPL, 65-65 dB SPL and 60-60 dB SPL, based on the results found by Osterhammel.
Figure 6. Comparison of mean amplitudes of DPOAE (in dB SPL), for frequencies of 1, 2 and 4 kHz, at intensities 70-70 dB SPL and 60-60 dB SPL, based on results found by Lopes Filho et al., 1995 (apud, 1996).
REFERENCES
1. ALBERTI, P W R. M. - Deficiência auditiva induzida pelo ruído. In: Otacílio & Campos -Tratado de Otorrinolaringologia. Ed. Roca, São Paulo, 934-949, 1994
2. BONFILS, P; AVAN, P - Distortion-Product Otoacoustic Emissions: Values for Clinical Use. Arch Otolaryngol Head Neck Surg. 118: 1069-1076, 1992.
3. BRAY, P J. - Click evoked otoacoustic emissions and the development of a clinical otoacoustic hearing test instrument. London, 1989. (Tese - Doutorado - Universidade de Londres).
4. COUBE, C. Z. L. - Emissões Otoacústicas Evocadas por Produto de Distorção em Indivíduos com Audição Normal. São Paulo, 1997. (Tese - Mestrado - Pontifícia Universidade Católica de São Paulo)
5. GASKILL, A. S.; BROWN, A. M. - The behavior of the acoustic distortion product, 2f1-f2, from the human ear and its relation to auditory sensitivity. J. Acoust. Soc. Am. 88(2): 821-839, 1990.
6. GOBSH, H.; TIETZE, G. - Interrelation of Spontaneous and Evoked Otoacoustics Emissions. Hear. Res. 69: 176181, 1993.
7. HARRIS, F. P - Distortion-Product Otoacoustic Emissions in humans with high frequency sensorineural hearing loss. J Speech Hear Res. 33: 594-600, 1990.
8. HARRIS, F. P and PROBST, R. - Reporting Click-Evoked and Distortion-Product Otoacoustic Emissions Results with Respect to the Pure Tone Audiogram. Ear Hear, 12(6): 399405, 1991.
9. HAUSER, R.; PROBST, R. - The influence of systematic primary-tone level variation L2-L1 on the acoustic distortion product emission 2f1-f2 in normal human ears. J. Acoust. Soc. Am. 89(1): 280-286, 1991.
10. LONSBURY MARTIN, B. L. - Introduction to Otoacoustic Emissions. Am. J. Otol. 15(Suppl. 1): 1-3, 1994.
11. LONSBURY MARTIN, B. L.; CUTLER, W M.; MARTIN, G. K. - Evidence for the influence of aging on distortion product emissions in humans J. Acoust. Soc. Am. 89: 17491759, 1991.
12. ONSBURY MARTIN, B. L.; WHITEHEAD, M. L.; MARTIN, G. K. - Clinical Applications of Otoacoustic Emissions. J. Speech Hear Res. 34: 964-981, 1991.
13. LOPES F°, O.; CARLOS, R. - Emissões Otoacusticas. In: Otacílio and col. - Tratado de Fonoaudiologia. Ed. Roca, São Paulo, 221-237, 1997.
14. LOPES F°, O.; CARLOS, R. - Produtos de Distorção das Emissões Otoacústicas. Rev. Bras. ORL. 3(5): 224-237, 1996.
15. LOPES F°, O.; CARLOS, R.; THOME, D.; ECKLEY, C. Emissões Otoacústicas Transitórias a Produtos de Distorção na Avaliação da Audição em Recém-Nascidos com Poucas Horas de Vida. Rev. Bras. ORL. (3): 220-226, 1996.
16. KEMP, D. T. - Evidence of mechanical nonlinearity and frequency selective wave amplification in the cochlea. Arch Otorhinolaryngol. 224: 37-45, 1979.
17. KEMP, D. T ; RYAN, S.; BRAY, P - A Guide to the Effective Use of Otoacoustic Emissions. - Ear Hear, 11(2):93-105, 1990.
18. KIMBERLEY, B. P; HERNADI, I.; LEE, A. M.; BROWN, D. K. - Predicting Pure Tone Thresholds in Normal and Hearing-Impaired Ears with Distortion Product Emission and Age. Ear Hear. 15: 199-209, 1994.
19. KOK, M. R.; van ZANTEN, G. A.; BROCAAR, M. P Growth of Evoked Otoacoustic Emissions during the First Days Postpartum. Audiology. 31: 140-149, 1992.
20. NELSON, D. A. and KIMBERLEY, B. P - Distortion Product Emissions and Auditory Sensitivity in Human Ears with Normal Hearing and Cochlear Hearing Loss. J. Speech Hear Res. 35: 1142-1159, 1992.
21. NORTON, S. J.; STOVER, L. V - Otoacoustic Emissions: An Emerging Clinical Tool. In: KATZ, J. - Handbook of Clinical Audiology; 4a. Ed.; Ed. Williams & Wilkins: Baltimore; 1994.
22. OLIVEIRA, J. A. A. - Fisiologia Clinica da Audição: Coclea Ativa. In: Otacílio & Campos - Tratado de Otorrinolaringologia. Ed. Roca, São Paulo, 510-530, 1994. 23. PROBST, R.; HAUSER, R. - Distortion Product Otoacoustic Emissions in Normal and Hearing-Impaired Ears. Am. J Otolaryngol. 11: 236-243, 1990.
24. SMURZINSKI, J.- Longitudinal Measurements of Distortion-Product and Click-Evoked Otoacoustic Emissions Of Preterm Infants: Preliminary Results. Ear Hear. 15 (3). 210-223, 1994.
25. SMURZINSKI, J.; LEONARD, G.; KIM, D. O.; LAFRENIERE, D. C.; JUNG, M. D. - Distortion Product Otoacoustic Emissions in Normal and Impaired Adult Ears. Arch. Otolaryngol. Head Neck Burg. 116- 1309-1316, 1990.
26. TANAKA, Y ; O-UCHI, T.; ARAI, Y ; SUZUKI, J. Otoacoustics Emission as an Indicator in Evaluating Inner Ear Impairments. Acta Otolaryngol. (Stockh). 103: 644-648, 1987.
* Audiologist and Attendee of the Specialization Course in Audiology, Department of Otorhinolaryngology, Santa Casa de Misericórdia de São Paulo.
** Faculty Professor of Otorhinolaryngology
*** Master in Human Communication Disorders, PUC-SE Audiologist responsible for the Division of Otoacoustic Emissions.
Study conducted at the Division of Clinical Audiology, Department of Otorhinolaryngology, Santa Casa de Misericórdia de São Paulo.
Article submitted on December 12, 2000 Article accented on January 19, 2001.
Print: ![]()