

Year: 2004 Vol. 70 Ed. 1 - (12º)
Artigo Original
Pages: 74 to 82
 PDF PT
 Computed tomography in the diagnosis of retrofenestral otosclerosis
Author(s):
Andy de Oliveira Vicente 1,
Norma de Oliveira Penido 2,
Hélio K. Yamashita 3,
Pedro Luiz Mangabeira Albernaz 4
Keywords: otosclerosis, tomography, x-ray computed, cochlea
Abstract:
Aim: To identify the main tomographic findings of retrofenestral otosclerosis. Methods: A prospective and multicentric study using computed tomography (CT) of the temporal bone in 54 patients with a clinical and surgical diagnosis of otosclerosis. A tomographic analysis has been performed to evaluate the utility of CT scans in diagnosing retrofenestral otosclerosis, verifying the sites of predilection for otosclerotic lesions. In this study, 22 patients undergone CT scans of temporal bones have been included in order to investigate other otologic diseases and have constituted the control group. Results: The tomographic findings were mostly bilateral and the retrofenestral focus more prevalent was the pericochlear focus. Conclusions: The CT scan was useful in the identification of the retrofenestral focuses. The evidence of this focuses and the presence of the endosteal involvement of the cochlea can suggest a higher activity of the disease.
![]()
Introduction
The otic capsule comprises endosteal, endochondral and periosteal layers. Otosclerosis is a chronic inflammatory disease that promotes metabolic disarrangement of the endochondral layer of the human ear capsule, characterized by reabsorption and bone neoformation, having progressive hearing loss as its characteristic symptom 1, 2, 3.
Retrofenestral otosclerosis is characterized by the presence of otosclerotic foci in the pericochlear region, in the semicircular canals, internal acoustic canal, vestibule and cochlear and vestibular aqueduct 4, 5, 6.
Imaging studies have played an important role in the diagnosis as well as in the clinical management of otosclerosis. High resolution computed tomography (HRCT) is considered the preferred radiological exam to assess the labyrinthic windows and optic capsule 6.
CT scan can precisely demonstrate the active or spongiotic otosclerotic lesions that are visualized as hypodensity or radioluscent foci in the otic capsule, which can be single, multiple or confluent, caused by the excessive bone demineralization inherit to this stage of the disease. In retrofenestral disease, it is possible to evidence in the CT scan pericochlear luscence or hypodensity (double halo signal), which represents a band of endochondral demineralization of the cochlea, caused by the confluence of active otosclerotic damage. The involvement of semicircular canals, internal acoustic canal, vestibule and cochlea endosteal region can also be identified in patients with retrofenestral otosclerosis 6, 7, 8, 9, 10, 11, 12.
The purpose of the present study was to identify, through the use of HRCT, the main retrofenestral otosclerotic foci.
Method
Multicenter, prospective radiological study with 54 patients with otosclerosis seen and selected at the Ambulatory of Otorhinolaryngology, Federal University of Sao Paulo - Escola Paulista de Medicina, and Hospital Especializado CEMA. The diagnosis of otosclerosis was obtained from the clinical evaluation (history, ENT examination, pure tone and speech audiometry, immittanciometry) and by surgical confirmation, that is, evidence of stapes fixation without other apparent cause. All patients were submitted to HRCT to study the temporal bones, totaling 108 analyzed ears. The study included 22 patients submitted to temporal bone CT scan to investigate other otological affections (pulsatile tinnitus, chronic otitis media, peripheral facial paralysis, petrous apex damage, vestibular Schwannoma, external acoustic canal (EAC) fracture, EAC osteoma, ossicle chain malformation), which formed the control group.
CT scan were conducted at axial and coronal sections of 1-2mm thick and 1mm increment, with parameters of 1s, 90 to 200mA, 110 to 130kV, matrix of 512 x 512 and bone window between 3500 to 4000 HU centered at 350 to 650 HU, without intravenous contrast.
The tests were conducted and discussed with the radiologist. Otosclerotic lesions were characterized as hypodense areas in the otic capsule or presence of thickness foci and/or obliteration of oval and round window. The retrofenestral foci were identified according to location in the otic capsule, as follows:
1 - Pericochlear luscence (LPC)
1a -LPCl - mild
1b -LPCm - moderate (without involvement of cochlear endosteum)
1c -LPCs - severe (with involvement of cochlear endosteum)
2 - Focus on semicircular canals (FCSC)
2a - lateral (l)
2b - superior (s)
2c - posterior (p)
3 - Focus on internal acoustic canal (FMAI)
4 - Focus on cochlear basal turn (FGBC)
5 - Focus on cochlear medium turn (FGMC)
6 - Focus on cochlea aqueduct (FAC)
7- Focus on vestibular aqueduct (FAV)
8 - Focus on the vestibule (FV)
8a - Anterior wall (ant)
8b - Posterior wall (post)
8c - Medial wall (m)
The sites of otosclerotic lesions referred above were chosen according to histopathological and radiological evidence found in the literature.
During the CT scan analysis, we assessed the use of CT scan in the radiological diagnosis of retrofenestral otosclerosis. We also assessed bilateralism of CT scan findings and efficiency of CT scan sections (axial and coronal) to detect retrofenestral otosclerosis foci.
To compare the distributions of retrofenestral CT scan foci in both ears, as well as to compare between the distribution of these findings in the two types of CT scan sections, we used marginal homogeneity test.
Results
The studied population comprised 54 patients (108 ears) with clinical and surgical diagnosis of otosclerosis, being that 36 (66.7%) were female and 18 (33.3%) were male subjects. The ages ranged from 15 to 59 years, mean age of 40.8 years. The progression of the disease ranged from 5 months to 30 years, mean duration of 10.7 years. Family history of otosclerosis was negative in 33 patients (61%) and positive in 21 patients (39%).
Retrofenestral foci were evidenced and distributed according to the frequency of axial and coronal sections on the right ear (RE) and left ear (LE) (Table 1).
The distributions of retrofenestral otosclerotic foci evidenced in the CT scan are represented in Tables 2, 3, and 4.
The comparison between distribution of CT scan findings in both ears and the comparison between the distributions of CT scans obtained with both sections are represented in Tables 5 and 6.
Control group analysis
This group comprised 22 subjects (31 ears), 12 men (54.5%) ad 10 women (45.5%) aged from 14 to 65 years (mean age of 34.7 years).
Control group CT scan analysis
We observed the presence of mild pericochlear luscence (LPCL) in four patients (18.18%), or in six ears (19.35%). In two patients, LPCl was bilateral. There was an area of hypotransparency on the anterior wall of the vestibule in one ear (3.2%) in one patient (4.5%).
Discussion
Among retrofenestral foci, the one that deserves the most attention is undoubtedly pericochlear luscence, which is widely described in the literature, being that its presence is associated with cochlear otosclerosis.
Shin et al classified pericochlear foci in 2 types: pericochlear focus with endosteal involvement and without endosteal involvement 10. For didactic purposes, we classified LPC in our study as mild pericochlear luscence (LPCl), moderate (LPCm) and severe (LPCs). LPCl was not considered an otosclerotic lesion in our sample, despite the fact that it was not ignored. The exclusion of LPCl as otosclerotic lesion was owing to the fact that it generates subjective and controversial radiological interpretation. The interpersonal anatomical variability, osteopenia, proximity of bone narrow to the petrous apex (Figures 1A and B), as well as technical limitations of the CT scan are the main causes of ambiguous CT scan image 13, 14. In our study, LPCl was observed in 19.4% of the studied ears and it was found as the single CT scan finding in one patient (1.85%), bilaterally. The use of CT scan with bone densitometry or even scintigraphy (SPECT) could be a good alternative in these doubtful cases 6, 12, 15 (Table 2 and 3). LPCm represented a well-defined image of pericochlear hypodensity (double halo signal), but without promoting the involvement of the cochlea endosteum (Figure 1E and F). Shin et al. observed the presence of pericochlear focus without endosteal involvement in 9.78% and pericochlear focus with endosteal involvement in 3.5% of the cases with positive CT scan 10. LPCm occurred in 9.52% of the ears with positive CT scan and LPCs was evidenced in 5.95% of them (Tables 2 and 3). If we compare the addition of incidence of LPCm and LPCc in our samples (15.47%) with the pericochlear foci observed by Shin et al. 10 (13.28%), we can see the same agreeing facts. As to LPC, it is important to point out that these CT scan findings are not exclusive of otosclerosis and that other diseases can also generate cochlear capsule hypodensity, such as otosyphilis, osteogenesis imperfecta and Paget's disease 6, 13, 16. We believe that in cases in which the CT scan evidences diffuse and highly destructive foci of the otic capsule, such diseases should be also investigated.
The focus in the internal acoustic canal (ICA) is briefly referred by the radiological and histopathological literature of otosclerosis, being described in special in diffuse cases of the disease. Its incidence in histology studies varies from 10 to 25% 6, 17, 18, 19. In our sample, FMAI was found in six patients (11%) or in eight ears (7.4%), being that in all of them there were multiple otosclerotic foci in the CT scan (Table 4 and Figure 2).
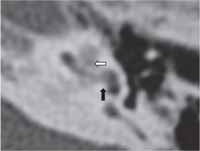
The visualization of the focus on the basal turn of the cochlea (FGBC) in the CT scan is undoubtedly very relevant since it can be responsible for sensorineural hearing impairment, especially in high frequencies. Otosclerotic damage in this region can cause marked structural disarrangement, alternating endosteal integrity of the cochlea and, in more severe cases, it is possible to observe the presence of marked bone neoformation, including intracochlear protrusion 6, 17, 20, 21, 22, 23. In our sample, FGBC was the only tomographic finding evident in the contralateral ear relative to the operated one (Figure 3 A). Another patient presented a focus of intracochlear hypodensity in the tympanic scala in one ear (Figure 3B). We think that in otosclerotic patients with marked decrease of bone responses in high frequencies, the region of the cochlear basal turn should be carefully analyzed in the CT scan.
In our sample, the focus on the region close to the cochlear aqueduct was demonstrated bilaterally in two patients (3.7%), both with multiple lesions of the labyrinthic capsule, including the lesions of JR (table 4 and Figure 4). Schuknecht and Barber reported that this lesion could be appointed as responsible for functional deficit of the inner ear 19. The authors observed that obliterative lesions of the round window could block the cochlear aqueduct. In the radiological literature, this finding has never been discussed. We believe that the involvement of the cochlear aqueduct in our patients was secondary to the focus on JR.
Semicircular canals can also be sites of otosclerotic lesions. Shambaugh evidenced otosclerotic foci in lateral semicircular canal in 3% of the ears submitted to fenestration surgery 1. Schuknecht observed an incidence of 2.4% of the lesions in the studied temporal bones 24. Veillon et al. included foci in the semicircular canals in their tomographic classification, but the incidence of this finding was not specifically described 25. In our study, we found focus on the lateral semicircular canals (FCSC) in 3.7% of the patients (2.7% of the ears), all of them with comprehensive disease (Tables 4 and Figures 5).
The involvement of the superior portion of the vestibule and also the affection of the superior vestibular nerve by the otosclerotic process were identified in the temporal bones of patients with otosclerosis and vertigo 26, 27. Tomographic evidence of these foci was referred in the literature, but in a non-specific fashion 6, 25. In our sample, we evidenced the focus on the anterior wall of the vestibule in 3.7% of the patients (2.7% of the ears) (Table 4 and Figure 6). It may be recommendable that in otosclerotic patients with vertigo episodes this region should be investigated in details by CT scan, especially in the anterior-superior portion.
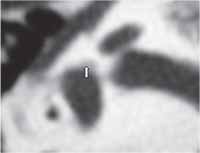
The apex of the cochlea can be impaired by otosclerotic lesions and according to Schuknecht and Barber, this is the third most involved site (12.2%) 19. In our study, we denominated such finding as focus of the medium turn of the cochlea (FGMC), which was observed in 1.85% of our patients (Table 4 and Figure 7). Swartz et al. observed by CT scan the impairment of this region in 12% of the patients with fenestral and cochlear otosclerosis 28.
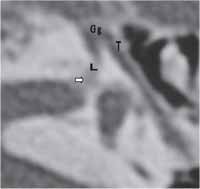
In our sample, one patient (1.85%) presented focus on the labyrinthic segment of the facial nerve (FCNFl) by CT scan (Table 4 and Figure 8). Histology evidence of the lesion in this portion of the auditory tube was briefly described by Nager, in more severe cases of otosclerosis 17. We believe that it is important to comment that this patient presented other otosclerotic foci in the otic capsule and that in the otoscopy the presence of Schwatze stain was evident, demonstrating greater degree of disease activity.
In our sample, there was no statistically significant difference between the two incidences (coronal and axial) in the diagnosis of retrofenestral foci (Table 5). Despite these evidences, in our opinion the axial section seemed to be more reliable than the assessment of the vestibule, cochlear aqueduct and basal and medium turns of the cochlea.
In 70 to 90% of the cases, otosclerosis is manifested bilaterally 1, 24. In our study, there was no statistically significant difference concerning positive responses of CT scan between the ears, that is, retrofenestral CT scans were bilateral in most cases (table 6).
In four patients (18.2%), or in six ears (19.3%) of our control group, we evidenced the presence of LPCi (Figures 1 A and B). The result was similar to the one in the group of patients with otosclerosis and it served to reinforce our position not to include LPCl in the context of otosclerotic foci. It was observed also that one patient (4.5%) had presence of hypodense focus on the anterior wall of the vestibule, in one ear (3.2%) (Figure 9). This tomographic evidence suggested that most probably there was a silent otosclerotic lesion (histology) in this region. Guild, by means of histology analysis of temporal bones in 1,161 patients, observed that 8.3% of Caucasians and 1% of African-descendents had histological evidence of otosclerosis, but the fixation of the stapes footplate occurred only in 12.3% of the ears affected by this osteodystrophy 29. The author emphasized the importance of distinguishing histology forms (asymptomatic) from clinical forms (symptomatic) of the disease. In the literature, the prevalence of otosclerosis ranges from 3 to 12% in the histology form and 0.1 to 1% in the clinical form 3, 30. In the other patients of this group we did not detect structural abnormalities of the otic capsule suggestive of otosclerosis.
Conclusion
Computed tomography proved to be effective in the diagnosis of retrofenestral focus and the presence of lesions should always be suspected and investigated by otorhinolaryngologists, even in patients with surgical indications.
CT scan evidence of these foci, together with endosteal involvement of the cochlea, can suggest greater disease activity. The use of anti-enzyme and anti-reabsortive medications such as sodium fluoride and biphosphonates should be indicated in such cases.Table 1 - DISTRIBUTION OF THE OTOSCLEROTIC FOCI OF RE AND LE AT AXIAL AND CORONAL SECTIONS
Table 2 - DISTRIBUTION OF LPC ON THE RIGHT EAR OF THE STUDIED POPULATION.
Table 3 - DISTRIBUTION OF LPC ON THE LEFT EAR OF THE STUDIED POPULATION.
Table 4-DISTRIBUTION OF THE OTHER OTOSCLEROTIC RETROFENESTRAL FOCI FOUND.
Table 5 - DESCRIPTIVE LEVELS OF THE COMPARISON BETWEEN CT SCAN SECTIONS (A/C).
Key: A=axial ; C=Coronal
* Marginal Homogeneity Test
Table 6- ASSESSMENT OF THE BILATERAL ASPECT OF THE CT SCAN FINDINGS.
* Marginal Homogeneity Test
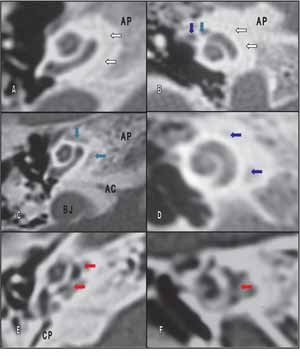
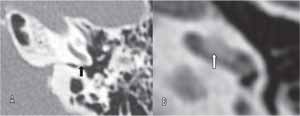
Figure 1(A-F): CT scan of the ear with pericochlear luscence (LPC). A: CT axial section at the level of the round window showing mild LPC (white arrows); B: CT coronal section evidencing LPCl (white arrows); C: CT axial section demonstrating moderate LPC (green arrows); D: CT coronal section showing LPCm (blue arrows); E: CT axial section evidencing severe LPC (red arrows); F: CT coronal section demonstrating LPCs (red arrow).
Blue arrow in B: tympanic segment of facial nerve
Green arrow in B: labyrinthic segment of facial nerve
AP: petrous apex; CP: posterior semicircular canal; BJ: jugular vein bulb;
AC: cochlear aqueduct
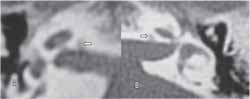
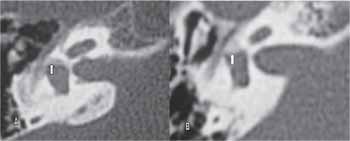
Figure 2(A-B): CT of temporal bone at axial sections, evidencing focus of hypodensity on the walls of inner acoustic canal (blue arrows).
Figure 3(A-B): Temporal bone Computed Tomography at axial sections. A: CT evidencing hypodense focus on the cochlear basal turn (blue arrow); B: CT evidencing hypodense focus on the lumen of the cochlear basal turn (green arrow).
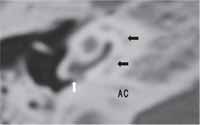
Figure 4: Temporal bone computed tomography on the right showing moderate pericochlear luscence (blue arrows) and hypodense focus on the lateral extremity of cochlear aqueduct close to the round window (red arrow).
AC: cochlear aqueduct
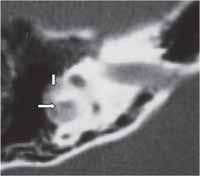
Figure 5: Temporal bone computed tomography on the right at axial section showing hypodense focus on lateral semicircular canal (blue arrows).
Figure 6(A and B). Temporal bone computed tomography on the right at axial section showing hypodense focus on the anterior wall of the vestibule (blue arrows).
Figure 7: Temporal bone computed tomography on the left at axial section showing hypodense focus on cochlear basal turn (green arrow) and hypodense focus on cochlear medium turns (red arrow).
Figure 8: Temporal bone computed tomography on the right at axial section showing hypodense focus and irregularity of the labyrinthic segment of the facial nerve canal and on the floor of the internal acoustic canal (red arrow).
T = facial nerve of tympanic segment; Gg = geniculate ganglion
L = labyrinthic segment of facial nerve
Figure 9: Temporal bone computed tomography at axial section showing hypodense focus on the anterior wall of the vestibule (red arrow) in control group patients.
References
1- Glasscock ME, Shambaugh GE. Surgery of the Ear. 4th ed, Philadelphia: WB Saunders, p.371-387,1990.
2- Sorensen MS. Temporal bone dynamics, the hard way: formation, growth, modeling, repair and quantum type bone remodeling in the otic capsule. Acta Otolaryngol Suppl (Stockh) 1994;512:1-22.
3- Chole RA, McKenna M. Pathophysiology of otosclerosis. Otol Neurotol 2001;22:249-257.
4- Rovsing H. Otosclerosis fenestral and cochlear. Radiologic Clinics of North America 1974;12(3):505-515.
5- Swartz JD, Faerber EN, Wolfson RJ, Marlowe FI. Fenestral Otosclerosis: significance of preoperative CT evaluation. Radiology 1984;151(3):703-707.
6- Valvassori GE: Imaging of the Otosclerosis. Otolaryngol Clin North America 1993;26(3): 359-371.
7- Maffe MF, Valvassori GE, Deitch RL. Use of CT in cochlear otosclerosis. Radiology 1985a;156:703-8.
8- Blakley BW, Hilger A, Taylor S, Hilger J. Computed tomography in the diagnosis of cochlear otosclerosis. Otolaryngol Head Neck Surg 1986;94(4):434-438.
9- Shin YJ, Deguine O, Sevely A, Manelfe CL, Fraysse B. Pure Sensorineural hearing loss and otosclerosis. Rev Laryngol Otol Rhinol 2000;121(2):45-47.
10- Shin YJ, Fraysse B, Deguine O, Cognard C, Charlet JP, Sévely A . Sensorineural hearing loss and Otosclerosis: a clinical and radiologic survey of 437 cases. Acta Otolaryngol 2001a;121:200-204.
11- Goh JPN, Chan LL, Tan TY.MRI of cochlear otosclerosis. The British Journal of Radiology 2002;75(894):502-5.
12- Berrettini S, Ravecca F, Volterrani D, Forli F, Boni G, Neri E, Francheschini SS. Single Photon Emission Computed Tomography in Otosclerosis: Diagnostic accuracy and correlation with age, sex, and sensorineural involvement. Otol Neurotol 2002;23:431-438.
13- D`Archambeau O, Parizel PM, Koekelkoren E, De Heyning V, De Schepper AM. CT diagnosis and differential diagnosis of otodystrophic lesions of the temporal bone. Eur J Radiol 1990;11:22-30.
14- Harcourt JP, Lennox P, Phelps MD. CT screening for temporal bone abnormalities in idiopathic bilateral sensorineural hearing loss. J Laryngol Otol 1997;11:117-121.
15- Valvassori GE, Dobben GD. CT densitometry of the cochlear capsule in otosclerosis. AJNR 1985;6:661-667.
16- Sonne JE, Zeifer B, Linstrom C. Manifestations of otossífilis as visualized with computed tomography. Otol Neurotol 2002;23:806,807.
17- Nager GT. Sensorineural deafness and otosclerosis. Ann Otol Rhinol Laryngol 1966;75: 481-511.
18- Nager GT. Histopathology of otosclerosis. Arch Otolaryng 1969;89:157-179.
19- Schuknecht HF, Barber W. Histologic Variants in otosclerosis. Laryngoscope 1985;95:1307-1317.
20- Lindsay JR. Histopathology of otosclerosis. Arch Otolaryngol 1973;97:24-29.
21- Phelps P. The basal turn of the cochlea. The British Journal of Radiology 1992;65:370-374.
22- Ruckenstein MJ, Rafter KO, Montes M, Bigelow DC. Management of far advanced otosclerosis in era of cochlear implantation. Otol Neurotol 2001;22:471-474.
23- Linthicum FH Jr. Histopathology of otosclerosis. Otolaryngologic clinics of North America 1993;26(3):335-352.
24- Schucknecht HF: Pathology of the ear. 2nd ed, Lea & Febiger, Philadelphia, 1993,p.365-379.
25- Veillon F, Riehm S, Emachescu B, Haba D, Roedlich Marie-Noëlle, Greget M, Tongio J. Seminars in Ultrasound, CT, and MRI 2001;22(3) 271-280.
26- Ghorayeb BY, Linthicum FH Jr. Otosclerosis inner ear syndrome. Ann Otol Rhinol Laryngol 1978;87:85-90.
27- Takasaki K, Sando Isamu, Hirsch BE. Loss of facial nerve fibers in a case of otosclerosis. Am J Otol 2000;21:766-768.
28- Swartz JD, Mandell DW, Berman SE, Wolfson RJ, Marlowe FI, Popky GL. Cochlear otosclerosis (otospongiosis): CT analysis with audiometric correlation. Radiology 1985a;155:147-150.
29- Guild SR. Histologic otosclerosis. Ann Otol Rhinol Laryngol 1944; 53:246-66.
30- Declau F, Van Spaendonck M, Timmermans JP, Michaels L, Liang J, Qiu JP, Van Heyning. Prevalence of otosclerosis in an unselected series of temporal bones. Otol Neurotol 2001;22:596-602.
1 Otorhinolaryngologist, Master studies under course, Discipline of Otorhinolaryngology, UNIFESP - EPM, Preceptor of the Residence in Otorhinolaryngology, Hospital Cema.
2 Affiliated Professor of Otorhinolaryngology, UNIFESP-EPM.
3 Joint Professor, Department of Imaging Diagnosis, UNIFESP-EPM.
4 Faculty Professor, Discipline of Otorhinolaryngology, UNIFESP-EPM.
Study conducted at the Ambulatory of Otorhinolaryngology, Federal University of Sao Paulo - Escola Paulista de Medicina, and Hospital Cema.
Address correspondence to: Andy de Oliveira Vicente - Rua Guaimbé 465, apt 10, CEP- 03118-030 - Sao Paulo SP.
Tel: (55 11) 6605-3929 - e-mail: andyvicente@uol.com.br
Article accepted as poster at III Congresso Triológico de Otorrinolaringologia.
Print: ![]()