INTRODUCTIONThe use of objective methods to assess hearing, associated to behavioral methods, has become frequent in the area of Clinical Audiology and it has contributed to the increased precision of central auditory disorder diagnosis.
Auditory evoked potential (AEP) investigation is an objective method currently in use that reflects the neuroelectrical changes that take place along the auditory pathway, from the cochlea to the auditory nerve and cerebral cortex, as a response to a stimulus or acoustic event.
In addition to enabling investigation of peripheral hearing, it also checks the integrity of central auditory pathways, the maturation during the development process and dysfunctions caused by different affections. Moreover, the methodology allows the follow up of cerebral activity over time and precisely, in milliseconds, thus, informing not only the processing final product but also the sequence, time and stages of the specific processes18.
According to Mc Pherson (1996), developmental changes observed in AEP are related not only to functional and anatomical elements, but also to organizational patterns that result from behavior and learning. In view of that, we emphasize the contribution of long latency auditory evoked potentials (LLAEP) to investigate cognitive skills involved in information processing (attention, discrimination and memory). The main potentials (waves) described are: N1, P2, N2 and P3.
P3 or P300 is the latest wave that appears after the N1-P2-N2 complex, as an objective response related to fundamental aspects of the mental function: perception and cognition. Since it is a potential influenced by the functional use the subject makes of the stimulus, it is considered endogenous and it is also called cognitive or event-related potential.
P300 is consciously prompted in a discrimination task of different acoustic stimuli, called oddball paradigm or target paradigm. In this type of task, the patient is presented two different types of acoustic stimuli through binaural phones: the so-called frequent stimuli (EF), presented at constant time intervals, and rare stimuli (ER) that are introduced randomly among the former. The subject is instructed to pay attention and count silently the number of ER that are recognized and discriminated. We can make use of pure tones of different frequencies (EF - 1000Hz and ER - 2000Hz) or speech stimuli that differ in voiced x voiceless characteristics (EF - /pa/ and ER - /ba/) to elicit responses.
Although it is considered an objective assessment method, P300 can be affected by some factors that contribute to the variability in measures (wave latency and amplitude). We can list the related variables: parameters used in the test (intensity, frequency and type of prompting stimulus, filter, type of task, inter-stimulus interval, etc.); recording conditions (time of the day), and the subject (age, maturation, gender, cognitive skills, body temperature).
In addition to the well-known variables that are controlled by examiners, we would like to point out the subjectivity involved in the identification and marking of P300 wave. It is a result of lack of one or more defined and standardized criteria for analysis.
The studies reported in the literature use different methodologies both to identify P300 (considering morphology26, 27, 17, 28, 29, 15, 9, 24, 6, 12, wave reproducibility3, 8, 13, 10, 4 and latency interval2, 23, 19, 5), and to mark down latency and amplitude measures expected for the age range (considering the maximum wave amplitude peak13, 26, 27, 17, 29, 15, 9, 19, means between replications11, 3, 8, 15, the point closest to 300 ms5, point of most replicable wave9, 4). Some terms used, such as "the highest peak", "the largest wave", "the first peak", "the most prominent or well-shaped wave", may lead to different interpretations by the examiners, generating differences in results among the studies.
P300 latency measures found in the literature for the age range 5 to 18 years reach 240 to 700 ms for the normal population, that is, without auditory, neurological, cognitive and psychological abnormalities. Even if we consider the subjectivity of determining the wave, owing to lack of uniform analysis criteria among different studies, it may contribute to the increased variability of the measure observed by them. Thus, a more careful investigation referring to the identification methods and analysis of P300, as used by the examiners, intends to provide further safety in clinical and scientific applications of this cognitive potential.
The present study aimed at investigating stability of analysis and interpretation of P300, following pre-determined criteria. In addition, it has also investigated the variability of P300 mean latency attributed to the examiner and the main points of difficulty in the analysis of waves, in order to suggest criteria for the analysis of P300 with good inter and intra-examiner applicability.
MATERIAL AND METHODFour Audiology professionals participated in this study: 3 speech and hearing therapists and 1 otorhinolaryngologist, denominated examiners, with theoretical and practical experience with auditory P300. The professionals agreed to participate and signed an informed consent previously approved by the Research Ethics Committee of the Nursing School/USPRP.
The material used in the study consisted of long latency auditory evoked potential (LLAEP - P300) previously performed in volunteers, which have already participated in previous studies in the same area (equipment/software Ati - - Nautilus PE - version 4.19c - LERMED S.R.L - Argentina, 1992). The tests were part of the auditory evoked potential files of the Laboratory of Experimental Psychology of the Department of Psychology and Education (School of Philosophy, Science and Languages/USPRP).
We selected 35 cases of children and adolescents aged 8 to 18 years, both genders, with normal peripheral hearing (basic audiological assessment was previously performed), no past or current history of neurological, auditory, psychiatric or learning problems (clinical history was previously taken). The search for LLAEP was performed twice in each ear (replicate) and we collected a total of 70 recordings.
The 70 selected recordings were made in 4 separate diskettes containing only wave tracings without indications (Figure 1). Each examiner received a diskette together with guidelines for data collection.
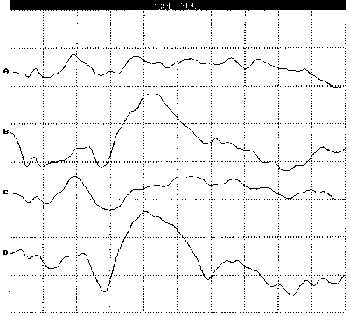
Figure 1. Recordings of replicated P300, containing 2 tracings of frequent stimulus (A and C) and 2 tracings of rare stimulus (B and D).
Examiners were instructed to analyze the 70 recordings, following only the criterion defined for detection of P300. The analysis consisted of identification of LLAEP waves (N1, P2, N2 and P300) in the screen and to mark the latency and amplitude values of tracings using the computer cursor for later printing. Analyzes were made twice in each of the 70 tracings with minimal time interval of 1 week. The examiners chose different days to analyze the recordings and avoided exchange of information about them during data collection.
We defined criteria to identify P300 wave and the components N1, P2, N2 and to write down the values of latency and amplitude, using as reference the points in common with the criteria referred by the literature, using studies with the same age range16, 27, 1, 28, 14, 23.
Complex N1-P2-N2 - three first waves that presented sequence and presented negative - positive - negative polarity, respectively, occurring in the replication of frequent and rare tracings, between 60 and 300ms.
P300 - greatest positive wave, right after the complex N1 - P2 - N2, occurring in the replication of the tracing of rare stimulus, between 240 and 700ms.
The following recommendations were also made:
- Identify the waves, considering the replication of tracings (wave overlapping) and to mark down only the best tracing for the rare stimulus.
- Latencies should be marked in the highest peak, that is, in the point of maximum wave amplitude.
- Amplitudes should be marked from the wave peak to the baseline.
- If you do not find P300 wave, do not mark anything.
To identify the waves, the overlapping of frequent and rare tracings was emphasized on the recording replication. The minimum and maximum latency values, both for complex N1 - P2 - N2 and P300, took the supporting role in the proposed task. This recommendation is based on two aspects: 1) when the identification of the wave is restricted to a pre-defined latency range, many "real" waves can be ignored25; 2) the great variation found in interval values in the researched studies. Thus, rather than on latency interval, we focused on tracing replication, making the wave choice procedure more objective.
We considered the latency interval (minimum and maximum values) of complex N1 - P2 - N2 and not the individual values of the components because we understood that P300 was the main focus of analysis and the complex of waves should only support its identification, but with a secondary role in the study.
The criterion suggested for the identification of P300 as the "largest wave right after complex N1 - P2 - N2" was chosen considering the observations of P300 tracings obtained in our practice, in agreement with most of the studied papers25, 16, 27, 14.
The latency value marking for P300 always in the highest peak or the maximum wave amplitude point prevents confusion in cases of bifurcated waves or double peak waves. The marking of amplitude from wave peak to the baseline is recommended to prevent contamination of neighboring waves in individual values28.
We considered the possibility of not identifying P300 since the neurological maturation is a determinant factor in the age range selected for the present study.
RESULTS AND DISCUSSIONQuantitative Analysis of Tracings: checking the appropriate use of P300 criteria and presentation of types of errors detected.
In order to check the appropriate use of the defined criteria, we used P300 latency as a reference, following the literature trend that considers it more constant and reliable. Out of a total of 70 recordings analyzed twice for each of the 4 examiners, we gathered 560 P300 latency measures.
To define the limit of sample variation we established the value of 2 standard deviations above the mean (313.8ms - SD 36.8ms and minimum value - 272.7ms / maximum - 502.5ms). All measures that exceeded this distribution dispersion and also those that were not recorded (in cases in which P300 was not identified), were investigated separately. Of the 560 measures, 33 (5.9%) presented values off the limits defined as mean + 2 standard deviations. The case-by-case investigation of these measures (N=33) revealed the occurrence of inappropriate use of the criteria, which we named as "error in using the criteria". It means that the examiner did not systematically follow the pre-defined criteria neither to identify the wave nor to mark the values of latency and amplitude. The tracings with wave marks were analyzed by two judges who together investigated the causes of measure variability comparing the inter and intra-examiner analyses and considered the steps defined by the criteria.
We identified 5 types of errors in the analysis of tracings of examiners characterizing the inappropriate use of criteria, being 4 in wave identification and 1 in recording the values of latency and amplitude (Table 1).
Table 1. Distribution of types of errors made when using the criteria according to frequency of occurrence in the first and second analysis of examiners (N=33).

Key: A - did not identify the largest wave, right after the N1-P2-N2 complex; B - did not follow the replication of tracing; C - identified nonexistent wave; D - did not identify the wave; E - did not mark the latency of the peak or the wave maximum amplitude point.
The errors in identification and recording of waves that occurred in the analyzes of examiners showed that there were greater difficulties in interpreting results of P300 with poor tracings (poor reproducibility and pattern and morphology, interference of artifacts or differences in attention performance), which represented the minority of the sample.
In the tracings considered good to the analysis, we could observe that they were replicated and, thus, wave morphology and latency could be compared. N1-P2-N2 complex was present and could be identified in all tracings (frequent and rare stimuli). P300 wave was clearly identified in replication of tracings of the rare stimulus as being the largest positive wave right after the N1-P2-N2 complex (Figure 2).
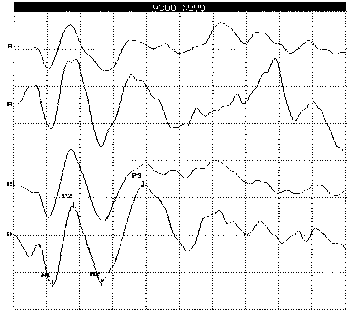
Figure 2. P300 in a 12-year-old child (with replication). A and C are frequent stimulus tracings; B and D are rare stimulus tracings. Latency 311ms (D).
Types of Errors
1. Did not identify the largest wave, right after N1-P2-N2 complex.
Inappropriate identification of wave can both reduce (Figures 3 A-B) or elevate individual latency of P300, contributing to the mean increase of measure variability of normal groups of the same age range28.
The most frequent error was not to identify P300 as the largest wave that appears right after N1-P2-N2 complex, indicating that this issue in the criteria should be considered upon the analysis. Most studies in the literature on P300 referred to identification and recording of latency values of waves that precede P300 (N1-P2-N2). It suggests that these waves contribute to the process of determining the cognitive potential, since they present in a stable sequence with little difference in tracings for frequent and rare stimuli. In the present study, we observed the identification of waves in 100% of the analyses, confirming the tendency detected in the literature.
Many studies include these waves in the identification criteria of P300: ".... the largest wave right after N1-P2-N2 complex...."26, 16, 27, 28, 18, or "... the wave right after N2..."14, 8, 23, 5. The literature agrees with the support of the previous components of LLAEP to correctly identify P300, and therefore, we suggest that the presence of these waves can be considered in the identification criteria of P300 used by the examiners.
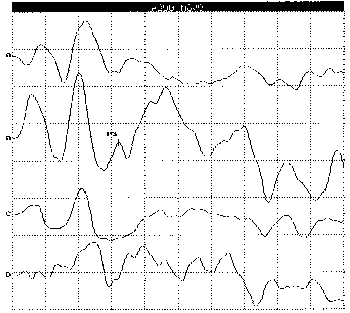
Figure 3A. Incorrect identification of P300 (latency in Figure 3B - Correct identification of P300 following the 255ms in tracing of the rare stimulus). Criterion of "largest wave right after N1-P2-N2 complex" (latency in 367ms in the rare stimulus tracing).
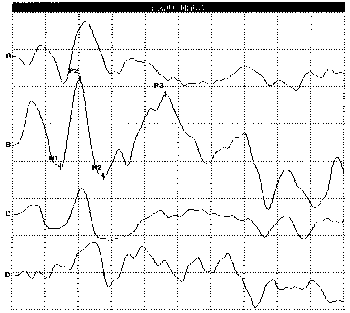
Figure 3B.
2. Did not follow the tracing replication.
Since the P300 is present only in the rare stimulus tracing, since it reflects the discrimination skill between stimuli, the replication of the tracing defines the test-retest validation7.
In good tracings (defined wave morphology, few artifacts, good task performance - attention level), the likelihood of P300 being present as the largest wave right after N1-P2-N2 complex increases in both tracings (replication). But when the tracing is poor, the likelihood decreases and leads to doubtful analysis (Figures 4 A-B).
In the literature we find different forms of replication, depending on the performance of number of derivations or setting up of electrodes allowed by the equipment. The Cz position (vertex) is the most used one by the authors to identify the waves when the equipment has only one recording channel. In this case, the tracing is replicated at least once and the waves are identified in the comparison between them2, 14.
Two or more recording channels allow the use of active electrodes in other positions, and Fz and Pz (scalp midline) are the most frequent ones. The recording derived from the 3 midline positions shows P300 wave increasing in size (amplitude) from the frontal to the parietal electrode, in the sequence Fz® Cz ®Pz 28. This feature helps the identification of P300 since the wave can be observed in various tracings.
The recommendation to consider the overlapping of waves was found in various studies8, 5, 3, in which in addition to replicating the rare stimulus tracing, they used the comparison between 2 active electrodes (Pz and Cz) to identify P300 wave.
Another less used resource is to identify P300 in the tracing resulting from the difference between rare and frequent stimuli (Rare - Frequent), but always considering the replication of the recording10, 2.
In the present study, owing to the limitation of equipment (one recording channel), we used only one site for the active electrode (Cz), emphasizing the importance of considering the application of the tracing to identify P300.
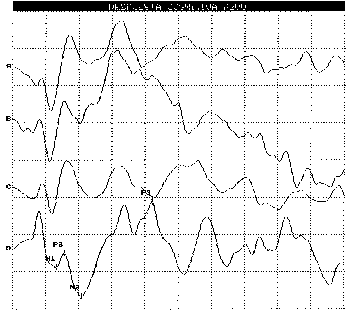
Figure 4A. Incorrect identification of P300; Figure 4B - Correct identification of P300 following (latency in 336ms in rare stimulus tracing). replication of tracing and wave overlapping (latency in 252ms and 267ms in rare stimuli B and D, respectively).
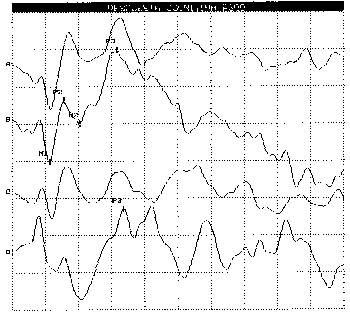
Figure 4B.
3. Identification of nonexistent wave.
Since maturation of auditory central nervous system (ACNS) directly influences the formation of cognitive potential, it may be absent in the recording of younger children, even if audiologically normal27, 19.
The determination criteria of P300, recommended in this study, predicted this possibility since the selected sample had only children older than 8 years.
In the example that follows (Figures 5 A and B), N1-P2-N2 complex is well defined in all its tracings, but we did not observe the formation of a positive wave, right after N2, replicated in the tracing of a rare stimulus, as indicated in the identification criteria of P300. Conversely, we observed similarity in the tracings as of this point, which was not compatible with the P300 characteristics. Note also that the amplitude value of the supposed wave was very low (0.08mV) in the inappropriate analysis of examiners.
Some authors refer to the presence of two different sub-components of P300 (P3a and P3b) that can be observed in different prompting tasks with and without attention to stimulus29, 25, 28 or when the purpose is to follow the maturational process of the potential15. P3a is the earliest passively prompted sub-component (not task-related), presented from childhood with no differences after older age. P3b (the so-called P300), is the latest attention-dependent sub-component that suffers many changes as a result of development from childhood to adult age.
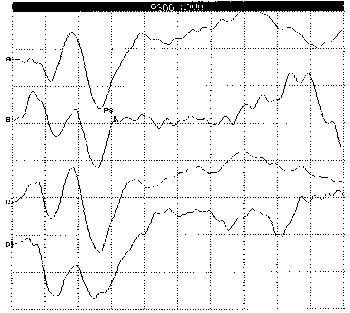
Figure 5A. Incorrect identification of P300 wave in Figure 5B - Correct identification of complex N1- rare stimulus tracing (latency of 247ms and amplitude P2-N2 with absence of wave P300 in 0.08 mV tracing in B). Of rare stimulus, note similarity of frequent and rare stimuli, right after N2.
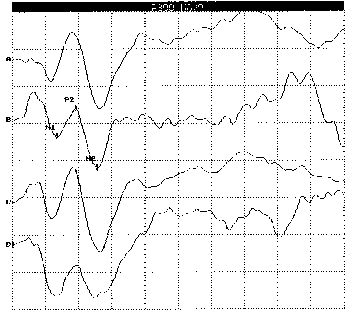
Figure 5B.
4. Did not identify the wave.
The occurrence of errors was greater in the 1st analysis of the examiners. They showed a trend to correct errors in the 2nd analysis, suggesting the effect of training in using the defined criteria.
Even though the tracings of the records were not well defined, the presence of waves of N1-P2-N2 complex and P300 waves were identified in most of the analyzes (Figures 6 A and B).
The occurrence of errors was supposedly caused by lack of attention to the items of the criteria used to identify the waves, upon the analysis. The idea to observe the similarities in replication of tracing of the rare stimulus was not considered. For difficult tracings, it is suggested that the wave analysis be performed by more than one judge (and tested the measured correlation between them) as recommended and used by some authors1, 14, 21.

Figure 6A. Non-identification and marking of P300. Figure 6B - Correct identification of P300, right after N1-P2-N2 complex, following the tracing replication of rare stimulus (latency of 339ms in both B and D and amplitude of 9.1 and 5.3mV in B and D, respectively).
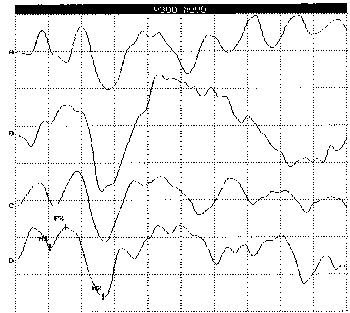
Figure 6B.
5. Did not mark latency of the highest peak or maximum wave amplitude.
This marking error of P300 latency was observed in only one recording of the selected sample (Figure 7 A and B).
It is a consensus in the literature to recommend marking P300 latency in the highest peak or maximum wave amplitude point10, 26, 16, 27, 14, 9, 8, 5, 3, 18.
In the presence of double peaks (P3a and P3b components) there are other procedures suggested to mark latency values: try to find the insertion point between the 2 lines in each side of the wave chosen (in the presence of the flat wave or double-peak)10, 2, 7, 14, or in the case of 2 peaks with close values, to calculate the mean between them10. These methods are criticized by Polich28 and we agree with the author because they make approximate measures, not directly produced in the subject's brain. The author recommended the use of maximum wave amplitude point, the so-called P3MAX as a more reliable procedure to mark the latency value of P300.
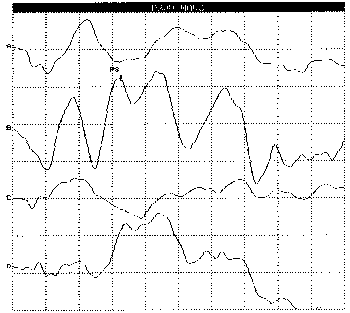
Figure 7A. Incorrect marking of P300 in the presence of Figure 7B - Correct marking of P300, in the presence of double peak (latency of 259ms and amplitude of 7.7mV). Double peak, maximum peak or maximum wave amplitude point (latency of 342ms and amplitude of 8.8mV).
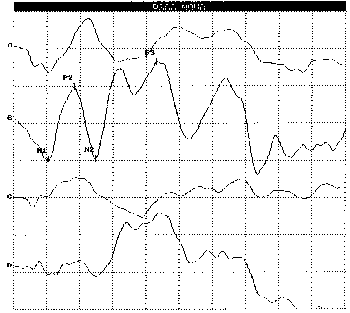
Figure 7B.
Quantitative Analysis: presentation and discussion of results by inter and intra-examiner analysis.
We investigated the variability of latency measures found in inter and intra-examiner analyzes. The measures with errors, that is, those that were resulting from inappropriate use of the criteria, we not excluded from the analysis.
There were no statistically significant differences in measures of P300 latency, between the 1st and 2nd analyses of each examiner (Table 2).
Table 2. Intra-examiner analysis with results of t-student test considering 2 samples with presumably equivalent variance.

Legend: Mean (1st) - mean value of P300 latency found in the 1st analysis of the examiner. Mean (2nd) - mean value of P300 latency found in the 2nd analysis of the examiner.
All examiners presented reliable analyzes as shown by Pearson's correlation coefficient (Figures 8 A, B, C and D). These results indicate the validity of the test-retest data, in which each examiner interpreted similarly the wave tracing, following the instructions explicit in the P300 determination criteria.
There were no statistically significant differences [F(3.258) = 0.4384 p= 0.7257] between the analysis of examiners for P300 latency values and they presented significant correlation indicating high agreement between examiners (table 3).
In the present study, upon comparing P300 latency measures, obtained with and without errors in using the criteria, we found values very close to the mean, standard deviation and minimum general value. Maximum general value had a 107.7ms reduction compared to the value obtained with error (Table 4). These findings suggested that appropriate use of the criteria to analyze the wave can take to shorter latency intervals, which reduced variability of the measures considered normal in a control population. The P300 latency potential found in the study was smaller than the suggested in the literature, for a population considered normal between 5 and 18 years. There seems to be greater agreement between the studies and minimum value (@ 240ms) than for maximum value (between 350 and 700ms).
Table 3. Correlation coefficient between measures (P300 latency) made by 4 examiners in each analyzed tracing (N=560).

Table 4. Distribution of latency measures (ms) of P300, obtained in the analysis of examiners, with errors in criteria use (N = 560) and without errors in criteria use (N = 527).

Minimum and maximum acceptable values of P300 latency can contribute to the difference in results25. It is important to understand the normal latency variation of P300, since in clinical practice, definition of abnormal is based on deviations from the mean population by 2 or 3 standard deviations26. According to the authors, the difficulties in defining components are a result from the variations in stimuli parameters, individual wave morphology differences and latency variability, which are present in a wide age range population. Measuring techniques including replication of records to identify the waves and consistent rule to measure P300 latency peak are recommended.
ASHA (American Speech, Language and Hearing Association), in 1990, wrote a document named "Competencies in Auditory Evoked Potentials - Measurement and Clinical Applications", in order to identify competence essential elements for appropriate training and professional development in the specific area. The document described 4 general rules including minimal competence skills and knowledge/skills required from the clinician/examiner.
Ferraro and Durrant (1999), in a discussion about the basic principles of applying auditory evoked potentials reminded us of the subjective aspects that may interfere in the recording of AEP: patient-related variables and examiner-related variables. The authors reported that the use of AEP is extended to different professions and, as a result, professionals that perform the test rely on different experiences. However, necessary competencies to refer, record and interpret AEP should go beyond professional training. ASHA document served as a guide for professional training and improvement, but the norms are standardized within the professions.
In this study, the rate of errors made when using the P300 criteria was approximately 6%. Although this value has not been statistically significant, it is worth referring to the negative impact a poorly interpreted test may cause, especially in clinical practice. Consequences of false positive or false negative results may compromise severely the appropriate diagnosis and management, affecting the health and well being of the patient20.
Errors were more frequent in the tracings considered poor. Poor tracings are part of the clinical routine especially when we assess subjects with cognitive and neurological abnormalities, or when we do not manage to completely control the interference in electrical/acoustic artifacts caused by the test environment. Owing to these cases, seriousness in defining the normal range should be adopted and the use of well-defined criteria to interpret the results contributes to it13.
Quantitative analysis of data, including error measures, showed that the number of errors made by the examiners, even though it was not irrelevant, did not contribute to significantly increase variability in individual measure of P300 latency. It meant great inter and intra-examiner agreement in how the wave tracing was analyzed. Finally, the P300 determination criteria used in the present study demonstrated good inter and intra-examiner applicability.
The identification of the most difficult points in analyzing the tracings led to suggested modifications in the criteria in order to improve its interpretation. This new version (Chart 1) emphasizes the following issues: - separation of items "wave identification" and "marking of latency and amplitude values"; - prioritization of items ; - greater emphasizes on identifying the complex of waves N1-P2-N2 to correctly identify wave P300; - greater emphasizes on the sequence, replication and morphology of waves; - less emphasizes on pre-determined pre-latency interval, which should vary according to age and maturational value of the assessed subject. The latency interval presented in the criteria was found in healthy subjects in the age range of 8 to 18 years and it should be considered for the application in clinical populations with different age ranges.
Chart 1. Suggested criteria for auditory P300 determination.Criteria for Determination of Auditory P300
Identify and mark the waves following the order presented below:
Identify N1-P2-N2 complex:
1) Three first waves that are shown in sequence,
2) with negative - positive - negative polarity, respectively,
3) occurring in the replication of tracings of frequent and rare stimuli,
4) between 60 and 300ms post-stimulus. *
Identify P300:
5) Highest wave with positive polarity right after N1-P2-N2 complex,
6) occurring in the replication of rare stimulus tracing,
7) between 240 and 400ms post-stimulus. *
Mark the amplitude and latency values of N1-P2-N2 complex and P300:
8) In the best tracing of the rare stimulus or in the tracing resulting from the sum of both replications,
9) wave peak latency or maximum amplitude point,
10) in wave P300 with double peak, mark the highest peak (maximum amplitude point).
* healthy subjects between 8 and 18 years of age.
CONCLUSIONSThe use of P300 cognitive potential in clinical practice is still limited. However, the possibility of correlating auditory behavioral aspects to observable physiological phenomena is a promising perspective for professionals involved in the study and assessment of auditory skills. Similarly to all new procedures, we have to carefully investigate both indications and limitations.
In the present study, we evidenced the need for appropriate training of examiners who want to work with auditory evoked potential, or P300. The use of well-defined criteria for the analysis of tracings (waves) can contribute to more reliable interpretations and results.
In order to increase the likelihood of correctly analyzing P300 wave, we suggest the use of the identification criteria (Chart 1) that emphasize the previous occurrence of N1-P2-N2 waves and overlapping of waves in replication of tracing of rare stimulus.
REFERENCES1. American Speech-Language-Hearing Association. Competencies in auditory evoked potential measurement and clinical applications. Asha 1990;Suppl. 2;(32):13-16.
2. Barajas JJ. The effects of age on human P3 latency. Acta Otolaryngol 1990; Suppl 476: 157-160.
3. Brown WS, Marsh JT & Larue A. Exponential electrophysiological aging: P3 latency. Electroencephalogr Clin Neurophysiol 1983;55:277-285.
4. César HAR & Munhoz MSL. O P300 auditivo em jovens e adultos saudáveis com uma nova proposta de resposta: levantar a mão. Acta Awho 1999;18(1):32-37.
5. Colafêmina JF, De Felippe ACN, Junqueira CAO & Frizzo ACF. Potenciais evocados auditivos de longa latência (P300) em adultos jovens saudáveis: Um estudo normativo. Rev Bras Otorrino 2000;66(2):144-148.
6. Diniz JJr. Contribuição ao estudo do potencial evocado auditivo de longa latência em crianças. [Dissertação de Mestrado] Universidade Federal de São Paulo - Escola Paulista de Medicina, 1996.
7. Ferraro JA & Durrant JD. (1999). Potenciais auditivos evocados: visão geral e princípios básicos. In: Katz J. (Ed.) Tratado de audiologia clínica. 4ª ed. São Paulo: Manole. pp. 315-336.
8. Finley WW, Faux SF, Hutcheson J & Amstutz L. Long latency event-related potentials in the evaluation of cognitive function in children. Neurology 1985;35:323-327.
9. Fukuda Y. P300 e ciclo menstrual em mulheres jovens normais. Tese (Livre Docência - Otoneurologia). Departamento de Otorrinolaringologia e Distúrbios da Comunicação Humana, Universidade Federal de São Paulo - Escola Paulista de Medicina, São Paulo, 1993.
10. Garcia-Larrea L, Lukaszewicz AC & Mauguière F. Revisiting the oddball paradigm. non-target vs. neutral stimuli and the evaluation of ERP attentional effects. Neuropsychology 1992;30(8):723-741.
11. Goodin DS, Squires KC, Henderson BH & Starr A. Age-related variations in evoked potentials to auditory stimuli in normal human subjects. Electroencephalogr Clin Neurophysiol 1978;44:447-458.
12. Hirayasu Y, Samura M, Ohta H & Ogura C. Sex effects on rate of change of P300 latency with age. Clin Neurophysiol 2000;111(2):187-194.
13. Howard L & Polich J. P300 latency and memory span development. Dev Psychol 1985;21(2):283-289.
14. Jacobson JT & Hyde ML. Uma introdução aos potenciais evocados auditivos. In: KATZ, J. (Ed.) - Tratado de audiologia clínica. 3 ed. São Paulo: Manole; 1989. p.504-541.
15. Jirsa RE. The clinical utility of the P300 AERP in children with auditory processing disorders. J Speech Hear Res 1992;35:903-912.
16. Kraus N & Mcgee T. Auditory Event-Related Potentials. In: Katz J. (Ed.) Handbook of Clinical Auditory. 4ª ed. Baltimore: Williams & Wilkins; 1994. p. 406-426.
17. Ladish C & Polich J. P300 and probability in children. J Exp Child Psychol 1989;48:212-223.
18. Leppänen PHT & Lyytinen H. Auditory event-related potential in the study of developmental language-related disorders. Audiol Neurootol 1997;2:308-340.
19. Lin E & Polich J. P300 habituation patterns: individual differences from ultradian rhythms. Percept Mot Skills 1999;88:1111-1125.
20. Mcpherson DL. Late potentials of the auditory system. (158p.). San Diego: Singular Publishing Group, Inc.; 1996.
21. Moraes IN. Erro médico e a lei. 4ª ed. (608p.). São Paulo: Lejus; 1998.
22. Morgan MD, Cranford JL & Burk K. P300 event-related potentials in stutterers and nonstutterers. J Speech Lang Hear Res 1997;40:1334-1340.
23. Oades RD, Dittmann-Balcar A & Zerbin D. Development and topography of event-related potentials (ERPs): Mismatch and processing negativity in individuals 8 - 22 years of age. Psychophysiology 1997;34:677-693.
24. Otsuka TMD, Sunaga YMD, Nagashima KMD & Kuroume MD. Correlation in children between latency and scores on the Wechsler Intelligence Scale for children-revised. Am J EEG Technol 1993;33:49-58.
25. Pfefferbaum A, Ford JM & Kraemer HC. Clinical utility of long latency "cognitive" event-related potential (P3): the cons. Electroencephalogr Clin Neurophysiol 1990;76:6-12.
26. Polich J, Howard L & Starr A. Effects of age on the P300component of the event-related potential from auditory stimuli: peak definition, variation, and measurement. J Gerontol 1985;40(6):721-726.
27. Polich J. Normal variation of P300 from auditory stimuli. Electroencephalogr Clin Neurophysiol 1986;65:236-240.
28. Polich J, Ladish C & Burns B. Normal variation of P300 in children: Age, memory span and head size. Int J Psychophysioly 1990;9:237-248.
29. Polich J. P300 in clinical applications: meaning, method and measurement. Am J EEG Technol 1991;31:201-231.
30. Squires NK, Squires KC & Hillyard SA. Two varieties of long-latency positive waves evoked by unpredictable auditory stimuli in man. Electroencephalogr Clin Neurophysiol 1975;38:387-401.
[1] Audiologist, Master in Sciences, School of Philosophy, Sciences and Language in Ribeirão Preto - USP, Professor of the Course in Speech and Language Pathology and Audiology, UNAERP.
[2] Professor, Ph.D. of the Department of Otorhinolaryngology, HCFMRP, Professor of the Post-Graduation Program in Sciences - Psychobiology Area, FFCLRP - USP.
Master dissertation, November/2001.
Study conducted at the Laboratory of Human Experimental Psychology, Department of Psychology and Education (School of Philosophy, Sciences and Language/USPRP).
Address correspondence to: Cinthia Junqueira - Rua Manoel Achê, 814/22 - Jardim Irajá
Ribeirão Preto SP 14020-590
Tel. (55 16) 623.5319, (55 16) 9717.4436 - E-mail: cinthiajunqueira@uol.com.br


