INTRODUCTIONAudiometric exams are essential for the analysis of efficacy of occupational hearing loss prevention programs because audiometry, within all the resources available, is a low cost test that provides information, is relatively easy to apply and is universally standardized. According to the Brazilian legislation 1, all subjects that work in environments with high sound pressure levels should be submitted to sequential audiometric tests to assess hearing status. The first audiometric test is conducted upon admission and it is considered as the reference for further comparison with all the other subsequent periodical tests to be conducted. Upon comparison, significant worsening of thresholds will be considered when pure tone thresholds increase 15dB or more for isolated frequencies and 10dB or more for the arithmetic mean of thresholds in the range of 500, 1000 and 2000 Hz or 3000, 4000 and 6000 Hz2. Significant worsening, if confirmed, is considered suggestive of the fact that high sound pressure levels have triggering or aggravated noise induced hearing loss 2. This fact characterizes the occurrence of occupational disease and triggers a number of mandatory measures to be taken in the areas of Occupational Safety and Social Welfare Services 3.
Reliability and validity of audiometric tests have been extensively investigated in auditory conservation programs in workers exposed to potentially harmful noise, either using or not hearing protectors. Hearing thresholds obtained in the industry are normally 5 to 15 dB lower than those obtained in the exams conducted in the office 4. The variability of audiometric recordings may be attributed to variation of responses given by the workers, training, performance, experience and potential of the examiner. Therefore, we should take into account variability and inconsistency of examiner and subject 5.
When workers undergo a repetitive number of tests, they learn how the test is conducted, become more attentive and less anxious, and at the same time more sensitive, learning how to respond with precision to the test. Thus, there is the so-called improvement in pure tone thresholds in the first periodical exams, as a consequence of the learning effect .
The learning effect has been observed in tests conducted in populations exposed to noise by analyzing sequential audiometric data in which there was 5dB improvement in hearing thresholds in the second test conducted 6. Significant improvement has been detected in the first 4 to 6 years of tests in frequencies of 3000, 4000 and 6000 Hz, in which 4000 Hz was the most affected one 7. Royster & Royster6 noticed that in the first years of hearing conservation programs, pure tone thresholds frequently improve because workers learned how to respond to minimum tones. Learning significantly reduced after the 3rd or 4th test conducted 4. In a previous study, Thomas & Royster8 did not find statistically significant differences in changes in thresholds between right and left ears but there was significant change when the tested ear showed worse thresholds in the second test.
Occupational safety and health professionals have been increasingly concerned with prevention of noise induced hearing losses. Tests and retests in industries are more frequent than the rates in offices. However, it is essential that admission thresholds are reliable or capable of serving as reference because the criteria that characterize triggering or aggravation of noise-induced hearing loss result from comparison of baseline thresholds with periodical tests. Brazilian legislation contemplates only significant worsening of pure tone thresholds in sequential tests 2. However, improvement from normal takes place in the first tests. As a result of learning effect, there is the need to change the reference of the admission test for the other subsequent one, with more reliable results. It will result in anticipation of preventive care for cases in which there are hearing losses.
The present study tried to identify the existence of the learning effect in the conduction of occupational audiometry in workers of a metallurgic industry. It also attempted to analyze how the phenomenon works in different frequency ranges.
MATERIAL AND METHODOut of the total of 1,190 workers of a metallurgic company in the countryside of Sao Paulo, we selected 167 male subjects aged 18 to 23 years who had been submitted to admission test and five more sequential ones, totaling 835 audiometric tests. They were conducted in the period between September 1992 and February 2002, within intervals that ranged from 6 months to one year. They were submitted to previous otoscopy and had been in auditory rest for at least 14 hours when they underwent the test. Audiometers were calibrated and exams were conducted in soundproof booth and by trained and skillful audiologists in occupational audiology.
They checked audiometric thresholds of workers in frequencies of 500, 1000, 2000, 3000, 4000 and 6000 Hz and calculated the arithmetic means of frequencies 500, 1000 and 2000 Hz (Mean 1) and 3000, 4000 and 6000 Hz (Mean 2), in both ears.
We considered as learning factor when the difference between the sequential test and the baseline test reached over 5dB or more, both for isolated frequencies and groups of frequencies.
Initially, we conducted descriptive analyses of all categorical variables. To statistically assess data, we used the method of Generalized Estimation (EEG)9,10, given that it was the appropriate method to treat the correlation between repetitive measures along time. The adopted level of significance was 5%.
Initially, we detected the number of workers that presented improvement of 5dB or more, at least in one frequency, between 500 and 6000 Hz, in any given side, within the analyzed period. Next, we compared the different sequential tests and their respective references to try to identify the presence of learning effect, both for isolated frequencies and groups of frequencies. Finally, using EEG, we analyzed influence of improvement based on time interval and examined side.
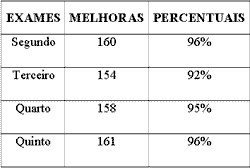
RESULTSUpon analyzing the 167 record charts we found that 92 to 96% of the workers presented improvement of at least 5dB regardless of frequency, between 500 and 6000Hz, comparing to sequential tests and the baseline (Table 1).
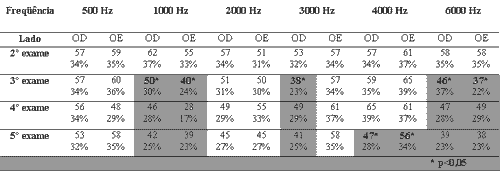
About 32-37% of the workers presented 5dB improvement in thresholds by frequency when compared to the second test; 22-39% presented improvement per frequency comparing the third and baseline; 17-39% of workers presented improvement of thresholds comparing the fourth and the baseline, and 23-35% of the workers presented improvement comparing the fifth exam and the reference one (Table 2).
Upon analyzing the mean thresholds by group of frequency we observed that 16-23% of the workers had 5dB improvement or more in mean thresholds comparing the 2nd test and the baseline one in Mean 1 (500, 1000 and 2000 Hz) and 19 - 21% in Mean 2 (3000, 4000 and 6000 Hz); 14% of workers improved upon comparing the third test and the reference one in Mean 1 and 14 - 15% in Mean 2; 8 - 16% of workers had improvement comparing 4th sequential test and the baseline in Mean 1, and 18 - 20% in Mean 2; 11 - 12% of workers had improvement in the comparison of fifth test and the baseline in Mean 1, and 11 - 15% in Mean 2 (Table 3).
We also observed that improvement in thresholds was maintained throughout the 4 tests conducted in 500Hz in both ears, 2000Hz in both ears and 3000Hz on the left side. In 1000Hz the improvement was not maintained after the 3rd test. In 3000Hz, improvement was not maintained after the 3rd test on the right. In 4000Hz, improvement was not maintained after the 4th test in both ears. In 6000Hz, improvement was not maintained after the 3rd test in both ears.
Upon applying the EEG method, p-value was higher than 0.05 showing that there was no evidence of the influence of improvement measure in the specified situations (Table 2).
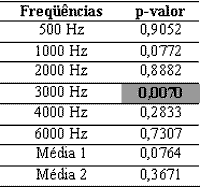
There was no statistically significant difference in improvement of thresholds comparing the right and left sides, except for the third to the second test in 3000Hz (Table 4).
DISCUSSIONIn industrial hearing conservation programs, the improvement in auditory thresholds is not taken into account, and when it occurs this fact is simply disregarded. However, in order to assess the progression of noise induced hearing loss (NIHL), Brazilian legislation asks for the analysis of significant worsening in isolated frequencies or in the arithmetic means of pure tone thresholds of 500, 1000 and 2000 Hz (Mean 1) and/or in 3000, 4000 and 6000 Hz (Mean 2). Worsening of thresholds of 15dB or more in isolated frequencies or 10dB in means is considered triggering or aggravation of NIHL compared to the reference test 2. Thus, it is extremely important to collect the real audiometric thresholds in the first test, because they will serve as parameter for future comparisons.
In subjects that are going to develop hearing loss owing to high-pressure level exposure, it is expected that sequential periodical audiometries present slow and progressive worsening of thresholds or, in some cases, even stabilization. But improvement has been detected in about one third of the cases in the first 5 years after exposure thanks to the learning factor.
The literature mentions that the causes for improvement are lack of workers' knowledge in the first audiometry, difficulty to understand and perform the responses, uncertainty and even fear that the results might prevent his/her admission in the job 6, 7. The high level of subjectivity of the audiometry allows questioning on reliability of the first test. After anxiety and doubts are gone given that the worker is employed and has already learned about the test, the subsequent periodical tests are conducted in better emotional conditions, higher attention levels and knowledge of the technique, already knowing how and when to respond to the stimuli. It is assumed, then, that the first audiometric test will show better pure tone thresholds than the initial one.
There is no anatomical or psychological explanation to pure tone threshold improvement both in normal hearing people and in those with NIHL, in which the lesion is irreversible and progressive, except for the learning factor.
The present paper studied the variations of thresholds in 5dB steps, regardless of being within the normal range or not. Comparing with the initial test (baseline) the four sequential tests showed improvement of 5dB as the most frequent one, but some tests showed 10dB improvement and some got as far as 15dB improvement. We recorded all 5dB or more variations both for isolated frequencies and for groups of frequencies.
We detected that over 92% of the analyzed audiometries had at least 5dB improvement in the frequency range 500 to 6000Hz. Considering how high these figures were, we tried to counterbalance subjectivity of the test by confirming the real changes of thresholds by successive sequential tests using statistical analysis.
We observed that there was significant improvement in thresholds of frequencies 500, 2000, 4000 Hz and on the left in 3000 Hz, persistent in the first 5 tests. It was not possible to explain the reasons for such differences in the present sample, but 22 to 39% of the workers presented improvement in thresholds that repeated up to the 3rd test and 23 to 35% persisted up to the 5th test.
The sample profile proved to be similar on both right and left sides in all frequencies except in 3000Hz, in which we detected learning factor was more long lasting on the left side than on the right side.
The learning factor is a topic that is little studied and for this reason not very well known in Otorhinolaryngology and Occupational Medicine. As detected, it is quite common and deserves to be carefully studied to be incorporated into the occupational audiological assessment routine.
Admission test may not be the best reference for comparison to detect hearing worsening, because the results might not be representative of the workers' real thresholds. Sequential tests that present improvement in thresholds should be transformed as a routine into new reference tests, for future comparisons. It would allow expressive anticipation of preventive care in noise induced hearing loss caused by occupational exposure.
CONCLUSIONThe learning effect occurred in more than one third of the workers in a metallurgic industry, generating improvement in pure tone thresholds in sequential audiometric tests when compared to the respective admission test. For this reasons, it has been confirmed that admission baseline tests are not always the best reference to be compared with periodical tests in companies. If the legal standards allow the reference test to be replaced by sequential tests with better thresholds, detection of occupational hearing loss will be significantly anticipated.
REFERENCES1. Brasil - Portaria Nº 24, Norma Regulamentadora (NR-7), Brasília, Secretaria de Segurança e Saúde no Trabalho, 29/12/1994 (DOU de 30/12/94).
2. Brasil - Portaria n.19, Brasília, Secretaria de Segurança e Saúde no Trabalho, 09/04/1998 (DOU de 22/04/98).
3. Brasil - OS/INSS Nº 608, Brasília, Ministério da Previdência e Seguro Social, 05/08/1998 (D.O.U. 19/08/1998).
4. Dobie RA. Reliability and Validity of Industrial Audiometry: Implications for Hearing Conservation Program Design. Laryngoscope 1983; 93: 906-27.
5. Howell RW, Hartley BPR. Variability in audiometric recording. British J Industr Med 1972; 29: 432-5.
6. Royster JD, Royster LH. Using Audiometric Data Base Analysis. J Occup Med 1986; 28: 1055-68.
7. Royster LH, Lilley MS, Thomas WG. Recommended criteria for evaluating the effectiveness of hearing conservation programs. Am Ind Hyg Ass J 1980; 41:40-7.
8. Thomas, WG, Royster LH, Scott, CE. Practice effects in industrial hearing screening. J Am Audiol Soc 1975; 1:126-30.
9. Stokes, ME, Davis CS, Koch GG. Categorical Data Analysis Using the SAS System. SAS Institute Inc. Cary. NC. 1996.
10. SAS System for Windows (Statistical Analysis System), v. 8.2. SAS Institute Inc., Cary, NC. USA 1999-2002.
11. Royster J. Baseline Revision Committee to Test Recommendations. Spectrum, National Hearing Conservation Association 1995; 12:1-7.
Table 1. Number and percentage of workers that presented 5 dB (or more) improvement in isolated frequency from 500 to 6000 Hz, in the comparison of sequential test and the baseline (N=167).

Table 2. Number and percentage of workers that presented 5 dB or more improvement per frequency in the comparison of sequential tests and the baseline (N=167).

Table 3. Number and percentage of workers that presented 5 dB or more improvement in Mean 1 (500, 1000, 2000 Hz) and in Mean 2 (3000, 4000, 6000 Hz) in the comparison of sequential tests and the baseline (N=167).

Table 4. Descriptive levels of parameters obtained by EEG method, checking the influence of side on improvement (N=167).


