INTRODUCTIONPrecise measures of the salivary flow are required for a variety of clinical and experimental protocols and for diagnosis of salivary gland dysfunctions1, 2. Marinho 3 stated that the importance of measuring the salivary flow is in the fact that it gives an idea of the quality of health, not only the oral health, but also about the quality of life of an individual.
The value of the salivary flow may be determined by measuring both volume and weight of the saliva collected. There are several non-stimulated methods to collect total saliva: in the draining method, the saliva flows by the lower lip and in the Spitting Method it is expelled through the spit. In both methods, saliva is collected in a graded tube; in the Suction Method, the saliva is aspirated and in the Swab Method, it is withdrawn from the mouth by previously weighted cotton rolls. 2,4,5. Navazesh and Christesen2 stated that the Swab and the Suction Methods supply some level of stimuli for saliva production, and this affects the measuring of the actual amount of non-stimulated saliva. On the other hand, the authors stated that the Spitting Method is the most reliable one. However, these methods in general, specially the Spitting Method, presented difficulties not only in sample collection itself, but also in obtaining the reading of the measure of salivary flow, and can not be performed in the doctors office. The need to find effective and easy to perform methods to measure salivary flow becomes evident. In ophthalmology, the measure of the amount of tears produced by a person is performed through the Schirmer Test, which is based on the use of paper placed on the path through where the tears trickle down. The proposal of this study is to test the feasibility of the same method to measure the salivary flow. Therefore, the objectives of this study are as follows:
1. Test the feasibility of the use of filter paper as a tool to measure salivary flow.
2. To check if there is a correlation between salivary flow values obtained with the Filter paper Method and the Spitting Method.
3. To make the Spitting Method more practical.
MATERIAL AND METHODThis paper was conducted in two phases: in vitro and in vivo.
In the in vitro phase, we tried to find in laboratory the most adequate paper to conduct the study and how to transform this paper into a measuring tool to be applied in human beings.
The filter papers tested were INLAB brand, manufactured by Alamar Tecno-Científica Ltda and distributed by Interlab a distributor of scientific products.
Four strips of filter paper were used for this test, with different technical specifications (INLAB nº 10, 30, 40 and 50) with the same width (1 cm), manufactured from discs of 9 cm diameter (the way the paper is commercially sold in the market). Each 1-cm extremity of the tape was introduced into a plastic container: one container with water, and the other with saliva. Three different intervals were recorded for each one of them. (1, 2 and 3 minutes, as well as the distance traveled by each one of the two liquids, in the different strips of filter paper). These strips were expected to have the following features:
1. To allow higher migration speed;
2. To allow identification of the propagation of the liquid;
3. To resist to moisture, without tearing down.
We built up an instrument with the strips of filter paper to measure the salivary flow, with the following features:
1. Easy to be placed and fixed in the oral cavity;
2. To be non-traumatic;
3. To contain a clearly visible millimeter scale;
4. To allow salivary flow to be measured in up to three minutes.
In the in vivo phase, after defining the type of paper and making the measuring instrument, it was adapted to measure the salivary flow in patients in up to three minutes. The filter paper was immersed in Methylene blue at 0.01% to make saliva migration more visible.
Seven (7) eutrophic-hydrated individuals were studied, from19 to 51 years old, in whom the salivary flow was measured, totalized128 samples. Salivary flow was also measured by the Spitting Method to check the accuracy of the results obtained with the Filter Paper Method. The first 28 samples collected by the Spitting Method were double, first saliva was kept in the oral cavity for three minutes and spitted all at once in the collecting tube, and in the second collection it was spited at every minute for three minutes. The collecting order was inverted in each sample. Subsequently, 100 samples were collected to compare the results obtained by the Filter Paper Method and the Spitting Method. To that end, saliva was stored with the filter paper being placed between the lips. After three minutes and after the reading of saliva migration in the paper, the paper was removed from the mouth and the saliva was immediately spited all at once in the collecting tube.
After collecting the first samples of saliva, the method was standardized Filter Paper Method and the steps are described as follows: after the patient dried his/her mouth swallowing all saliva, one extremity of the filter paper was introduced in the oral cavity, placed in the mouth floor, behind the lower incisors and in front of the tongue, and the other extremity of the paper hung outside on the lower lip vermilion (Figure 1). This distal extremity, with a visible millimeter scale, projected itself outside the mouth, tilted down towards the chin. In this way, the paper stayed properly fixed while closing the lips, during the time required for measurement. Immediately after placing the paper, the time was counted and distance traveled was recorded with the migration of saliva in the paper for three minutes. A digital watch was used to count the collection time.
The Spitting Method was standardized as follows: after the patient dried his/her mouth she/he should not swallow for three minutes, and at the end he/she would spit all saliva stored in the mouth in the collecting tube. The reading of saliva volume in the collector was performed after adding 3 ml of saline solution, with a support of a syringe in order to collect the drops of saliva retained in the walls of the tube; this extra volume was discounted from the total volume to get the precise salivary volume measure.
Some changes were made in the Spitting Method, such as: instead of a coupled funnel to a graded cylindrical tube, only a single collecting tube was used with the upper funneled extremity and sharpened base and millimeter base (Figure 2). One drop of an Ether-Alcohol antifoaming substance was used (Polyether Polyol in oily solution) to eliminate the foam present in saliva (Figure 3 and 4).
Sample collection was made in the morning, under artificial light, with the patient comfortably seated with eyes opened, head slightly tilted down, without talking or opening his/her mouth, the tongue could be moved, but saliva should not be swallowed during sample collection.
The values obtained by the Filter Paper Method were compared to those provided by the Spitting Method through a dispersion chart and static test with Pearsons correlation.
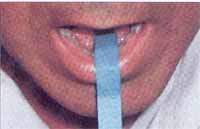
Figure 1. Measurement instrument on the floor of the mouth.
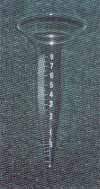
Figure 2. Collecting tube.
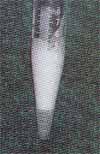
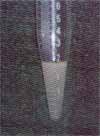
Figures 3 and 4. Before and after the use of antifoaming agent.
Graph 1. Values of salivary flow obtained by the Spitting Method and migration of saliva by the Paper Filter Method.
In the in vitro phase the distances traveled by saliva and by the water in the tested papers of the INLAB brand (Types 10, 30, 40, 50) are shown in Table 1.
The filter paper chose to be used in this study was the INLAB 30 brand, although all papers had decreased visibility of fluid propagation and proper resistance, only those that presented higher migration speed, both for water (6.6 cm/3min) and saliva (3.8 cm/3min), allowed readings in shorter time.
The strips used to make the measuring tool were filter paper of 1 cm wide and 7 cm long. This length was proper for salivary flow measures in vitro in up to three minutes.
In the in vivo phase the measuring instrument was adapted to be used in human beings, according to the features presented in the methodology: a flat angle fold was applied in the paper, dividing it in two asymmetric parts. The smaller part, with two centimeters was introduced in the mouth allowing the fixing of the instrument and making contact with the saliva stored. The five remaining centimeters were left outside, for the reading of salivary flow (Figure 1).
a) The strips were dyed by immersion in Methylene Blue solution at 0.01% for better visualization of salivary migration.
b) A scale was applied in the filter paper, graded in 5 mm intervals, as of the fold, which was the zero point of saliva migration allowing the measuring of salivary flow.
After collecting 100 samples by the Filter Paper Method and by the Spitting Method we obtained the results represented in Table 2. These values were distributed in a dispersion chart and the result is represented in Chart 1.
The statistical analysis was performed applying Pearsons correlation test, obtaining the following values: Correlation coefficient: r = 0.19; the correlation rate ranged from 0.58 to + 0.27, with p = 0.42.
The salivary flow values collected all at once, and those collected at every minute with the Spitting Method from the same patient are represented in Table 3.
Table 1 Migration of water and saliva in centimeters in the various types of filter paper at different times.
Table 2 Values of total non-stimulated salivary flow obtained simultaneously with the Spitting Method and the Filter Paper Method, in 100 samples.
Table 3. Distribution of saliva volumes, collected during 3 minutes with only one spit and with 3 spits by the Spitting Method in 14 samples of the same person, presenting the averages.
In order to conduct this study we used the filter paper INLAB 30 in the in vitro phase that corresponded to the Whatman 41, used in the Schirmer Tear Test. It was chosen for having porosity of 7.5 micron, substance of 85 g/m2, and 1% specificity of ashes, and for this reason it was able to achieve the fastest filtering speed among the tested papers. This was one of the features we were looking for in this method to have the measuring performed in shorter time. To allow the visualization of saliva propagation and not tearing when wetted were the other features we have looked for to develop the measuring instrument. The paper chosen, although it did not tear easily, it presented poor visibility of saliva migration. This made us dye it in blue, immersing it in Methylene Blue, because it is antiseptic and is frequently used in the health field at the concentration (0.01%) used, and it does not have side effects or blue stains on the skin and mucosa.
The migration of saliva in the filter paper did not present a uniform movement, with decrease in speed along the time (Table 1). This fact was extensively studied by Müller and Clegg6, which showed that liquid migration in the paper obeys the equation: d2 = Dt b, where d is the distance of migration of the liquid in the paper expressed in millimeters, t is the time in seconds, b and D are constants for a given paper and liquid. The constant D was called coefficient of diffusion, varying according to the superficial tension, viscosity and density of the liquid.6
After the values of the constants b and D were set, the values of salivary flow could be obtained from the migration distance of the saliva in the filter paper. The constant D (diffusion coefficient), however, depended also on the viscosity and superficial tension, varying according to the saliva concentration. This fact justifies the lack of correlation of the results obtained by the two different methods of the salivary collection.
According to Mason and Chisholm5, salivary viscosity will depend on the gland that is producing saliva. Among the factors that stimulate salivary glands to produce saliva 7,8, we have the type and length of stimulus8, the size of the gland9, the age of the individual10, the systemic effect of tasteful diets or those that require mastication11-13, besides the variations resulting from the circadian and circannual rhythm 4,14, and of the period of the menstrual cycle.5
Another reason for the lack of correlation is the evaporation of saliva while it migrates by the strip. The importance of the evaporation was first mentioned by Dawes4, when he reported that the evaporation of saliva could occur even inside of the mouth, with the passage of the inhaled air. Thylstrup and Fejerskov15 stated that this evaporation might reach 0.25 ml/min.
Although the Filter Paper Method did not prove to be effective against the Spitting Method to accurately measure the salivary flow, it can be very useful since it allows simple and easy detection of saliva in the oral cavity especially in outpatient care service and in offices.
It is discussed in the literature how long the ideal collection time should be. Kamali and Thomas16 recommended that it should last one minute, however, most of the authors recommend longer time intervals of up to 15 minutes. In this study we have set up the time in 3 minutes, since it is difficult for an individual to store saliva for a longer period without swallowing it or allowing it to escape to the oropharynx. If saliva is collected for a time longer than 3 minutes, the authors generally recommend the patient to spit the saliva at every minute. In this study, however, the collection of saliva, which was spited at every minute, worked as a stimulus to its production, since the average salivary flow collected in this way was 1.15 ml, whereas if collected all at once with a single spit at the end of the third minute the volume dropped to 0.48 ml. Navazesh and Christesen2 stated that the Swab and Suction Methods provide some level of stimulus for the production of saliva and that the Spitting Method is more reliable; in our opinion, this method only has some level of reliability if saliva is collected all at once.
According to Jones et al.1, the collection of saliva for a longer time hinders the calculation of the salivary flow in fragile and debilitated elderly patients, since these patients are unable to cope with sample collection for a long time. The fact of having set the collection time in 3 minutes in this study allowed this technique to be used also in such patients.
In face of the difficulties found during the performance of the salivary flow measurement with the conventional Spitting Method, some fine tune improvements were introduced to it. Instead of a funnel coupled to a graded cylindrical tube we used a single collecting tube with a funneled upper end and a sharp millimeter base. In order to create this tube, we eliminated one of the collectors simplifying the collection, after the saliva started to run through a single tube. By creating a sharp millimeter base, we could increase the accuracy of the measures, since the features of the base allowed the visualization and more precise recording of saliva level in the tube (Figure 2).
Another hindrance found in the Spitting Method was the presence of foam in saliva in the moment of reading the results. In order to eliminate it, some authors resorted to the collection of saliva in tubes cooled at zero degree centigrade 15, keeping it in the freezer at 6 degrees centigrade for 24 hours3, or subjected the saliva to centrifugation to eliminate the foam bubbles10. Obviously, the use of these complements makes it difficult to use the method, preventing it from being used in routine practice in the office. In our case, we used antifoaming ether-alcohol agent (Polyether-Polyol in oily solution) that is widely used in the yeasting process of sugar cane and alcohol mills and allowed instant measures (Figure 3 and 4). Other authors recommended the use of Octhanol drops, or 0.1 ml of Butylic-alcohol. 17
Although the changes applied to the Spitting Method made it more practical, and the Filter Paper Method proved not to be appropriate to accurately measure the salivary flow, it is important to point out that none of the methods described could accurately determine the value, since even if it determined total or selective saliva values, at rest or stimulated, it would not take into account the evaporated saliva or the saliva absorbed by the mucosa.4
CONCLUSIONBased on the results observed in this study, it was concluded that:
1. It is possible to use Filter Paper to detect the presence of saliva in the oral cavity.
2. The measures obtained by the Filter Paper Method did not have any correlation with the salivary flow measures collected with the Spitting Method.
3. The introduction of some refinement in the Spitting Method made it more practical and likely to be used in offices.
REFERENCES 1. Jones JM, Watkins CA, Hand JS, Warren JJ, Cowen HJ. Comparison of three salivary flow rate assessment methods in an elderly population. Community Dentistry and Oral Epidemiology 2000;28(3):177-84.
2. Navazesh M, Christensen CM. A comparison of whole mouth resting and stimulated salivary measurement procedures. J Dent Res 1982;61(10):1158-62.
3. Marinho MA de O. Avaliação do fluxo salivar durante radioterapia com o uso da associação de lauril-dietileno-glicol-éter-sulfato de sódio e hidróxido de cálcio. Tese (Mestrado) - Complexo Hospitalar Heliópolis, São Paulo, 1999, 86f.
4. Dawes C. Physiological factors affecting salivary flow rate, oral sugar clearance, and the sensation of dry mouth in man. J Dent Res Supplement 1987;66:648-53.
5. Mason DK, Chisholm DM. Salivary Glands in Health and Disease. London: W. B. Saunders Co. Ltd.; 1975.
6. Müller RH, Clegg DL. Choromatography on paper. Anal Chem 1951;23:396-04.
7. Rossi G. Salivary Gland Physiology. In: Rossi G. Radioisotope Study of Salivary Glands. Boca Raton: CRC PRESS; 1987. cap.1, p. 02-21.
8. Spielman A, Ben-Aryeh H, Gutman D, Szargel R, Deutsch E. Xerostomia - Diagnosis and treatment. Oral Surg 1981;51(2):144-147.
9. Streckfus CF, Wu AJ, Ship JA, Brown LJ. Comparison of stimulated parotid salivary gland flow rates in normotensive and hypertensive persons. Oral Surg Oral Med and Oral Pathol 1994;77(6):615-9.
10. Pedersen W, Schubert M, Izutsu K, Mersai T, Truelove E. Age-dependent decreases in human submandibular gland flow rates as measured under resting and post-stimulation conditions. J Dent Res 1985;64(5):822-25.
11. Guyton AC, Hall JE. Funções secretoras do tubo alimentar. In: Guyton AC, Hall JE. Tratado de Fisiologia Médica. 9ª ed. Rio de Janeiro: Guanabara-Koogan; 1997. p.735-49.
12. Jensen JC, Brodin P, Orstavik J. Parotid salivary flow rates in two patients during immediate denture treatment. J Oral Rehabilitation 1991;18(2):155-62.
13. Mandel ID, Wotman S. The salivary secretions in health and disease. Oral Science Revue 1976;8:25-25.
14. Bergdahl M. Salivary flow and oral complaints in adult dental patients. Community Dent and Oral Epidemiol 2000;28(1):59-66.
15. Thylstrup A, Fejerskov O. Saliva. In: Thylstrup A, Fejerskov O. Cariologia Clínica. 3ª ed., Santos; 2001. cap.2, p.17-43.
16. Kamali F, Thomas SH. Effect of saliva flow rate on saliva phenytoin concentrations: implications for therapeutic monitoring. Eur J Clin Pharmacol 1994;46(6):565-67.
17. Spealman CR. The volume flow of resting salivary secretion. Am J Physiol 1943;139:225-29.
1 Master Degree, Medical School of Ribeirão Preto, University of São Paulo.
2 Associated Professor, Medical School of Ribeirão Preto, University of São Paulo, Head of the Discipline of Head and Neck Surgery, Hospital das Clínicas.
3 Resident Physician in Otorhinolaryngology , Hospital das Clínicas, Medical School of Ribeirão Preto, University of São Paulo.
Address correspondence to: Rui Celso Martins Mamede Rua Nélio Guimarães, nº 170
14025-290 Ribeirão Preto SP Tel/fax (55 16) 602-2353 E-mail: rcmmamded@fmrp.usp.br
Article submitted on April 19, 2002. Article accepted on September 19, 2002